

clickhousectl, you can install the same skills into the coding agents it detects instead:
--agent (for example, --agent claude). Add --global to install into your home directory rather than the current project.
The collector runs as a gateway: a single OTLP endpoint that your applications, SDKs, and agent collectors send to. The gateway batches events, applies any processing you’ve configured, and writes them to ClickHouse via the ClickHouse exporter. This pattern keeps collection logic out of your application code and lets you scale ingestion independently of the workloads producing data. For background on gateway versus agent roles, see Collector roles.
Existing collectorIf you’re using an existing OpenTelemetry collector, we assume it’s already configured in a gateway role. We don’t recommend using this process for reconfiguring collectors in the agent role.
- I don't have a collector
- I have a collector
1
Gather your credentials
You’ll need: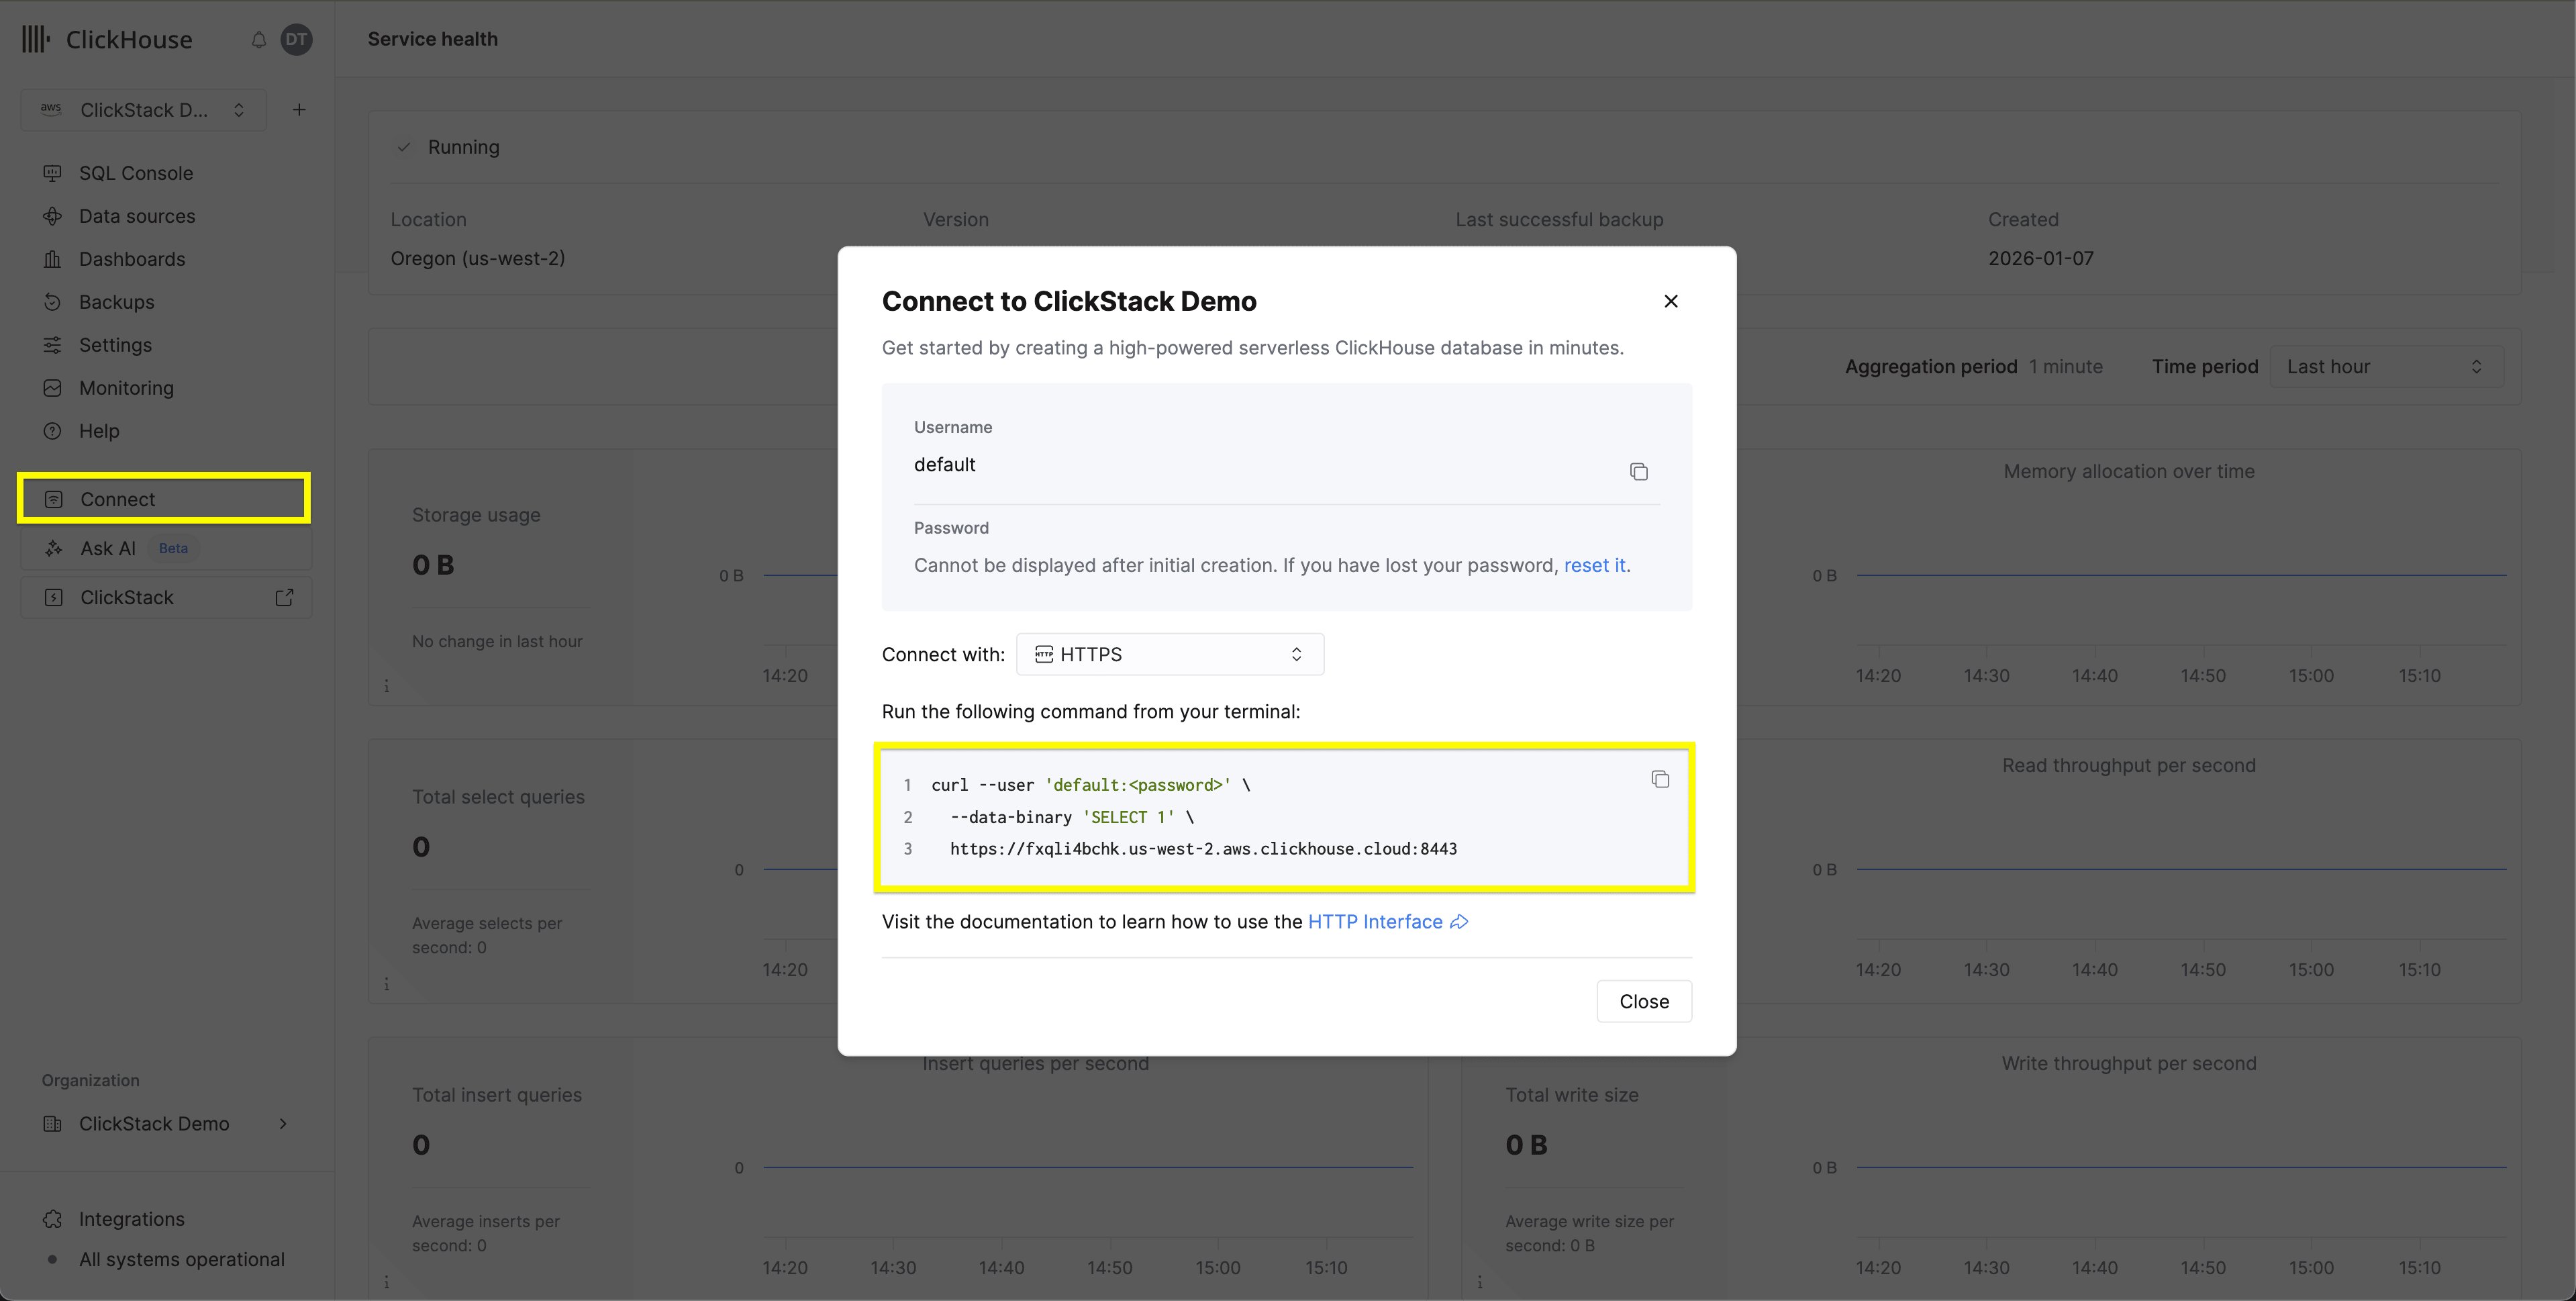
- The HTTPS endpoint of your ClickHouse Cloud service, including protocol and port, for example
https://abc123xyz.us-central1.gcp.clickhouse.cloud:8443. - A ClickHouse username and password for ingestion.
2
Create an ingestion user
We recommend creating a dedicated user for the collector rather than reusing The collector creates the schema for logs, traces, and metrics inside the
default. Connect to your service via the SQL console and run:otel database on first use. For more guidance on production user setup, see Going to production.3
Deploy the collector
Deploy the ClickStack distribution of the OpenTelemetry collector, which is preconfigured for Managed ClickStack. In the example below, we run the collector locally and generate artificial telemetry from the same machine for simplicity.Pick a shared secret to authenticate clients sending data to the collector, then export it alongside your connection details and chosen password for the Run the ClickStack OTel collector:The collector now exposes OTLP gRPC on
In production, you would typically deploy the collector in a Kubernetes cluster, or on a virtual machine that can be reached by your OpenTelemetry SDKs, agents, and other collectors. This allows telemetry from across your environment to be centrally collected and forwarded to ClickStack.
hyperdx_ingest user:4317 and OTLP HTTP on 4318. Applications, SDKs, and agent collectors should send to these ports with authorization: $OTLP_AUTH_TOKEN in the request headers.Production deploymentsFor production, we recommend enabling TLS on the OTLP endpoint. See Securing the collector.
4
Verify the endpoint
Generate some synthetic traffic against the collector to confirm the full pipeline works. We use Or install the binary with Go and target Define a small Send logs as a realistic mix of severities across services, mostly informational with a warning and an error rather than one uniform error stream:Logs alone confirm the endpoint is working. For a richer demo dataset, a multi-service Service Map and charts across metric types, expand and run the commands below as well. They reuse the
For the full set of flags and more variations, see Synthetic data with telemetrygen.
telemetrygen, the OpenTelemetry Collector Contrib generator, which emits OTLP logs, traces, and metrics and exposes flags to shape the data across services, severities, span statuses, and metric types.Run it from its Docker image (no install required). Define a small wrapper so the commands below stay readable; --add-host lets the container reach a collector listening on the host:localhost instead:What to expectEach
tg run lasts about 20 seconds (set by --duration 20s) and streams verbose logs the whole time, that’s expected; each run returns on its own once its 20 seconds elapse. The logs below are enough to confirm the pipeline; the optional richer set adds several more runs and takes a few minutes.tg helper so each command only specifies what varies (service, severity, status, attributes):tg helper, so run them in the same shell.Generate richer telemetry (optional)
Generate richer telemetry (optional)
Send multi-span traces from several healthy services plus one failing dependency. This gives the Service Map a realistic shape, mostly healthy with one erroring service, and still populates the error views:Send metrics across the three common types, so charts have a counter, a gauge, and a distribution:For even more variety, add a couple more services and an exponential histogram:
5
Confirm in the ClickStack UI
Open your service in the ClickHouse Cloud console and select ClickStack from the left menu and then Start Ingestion.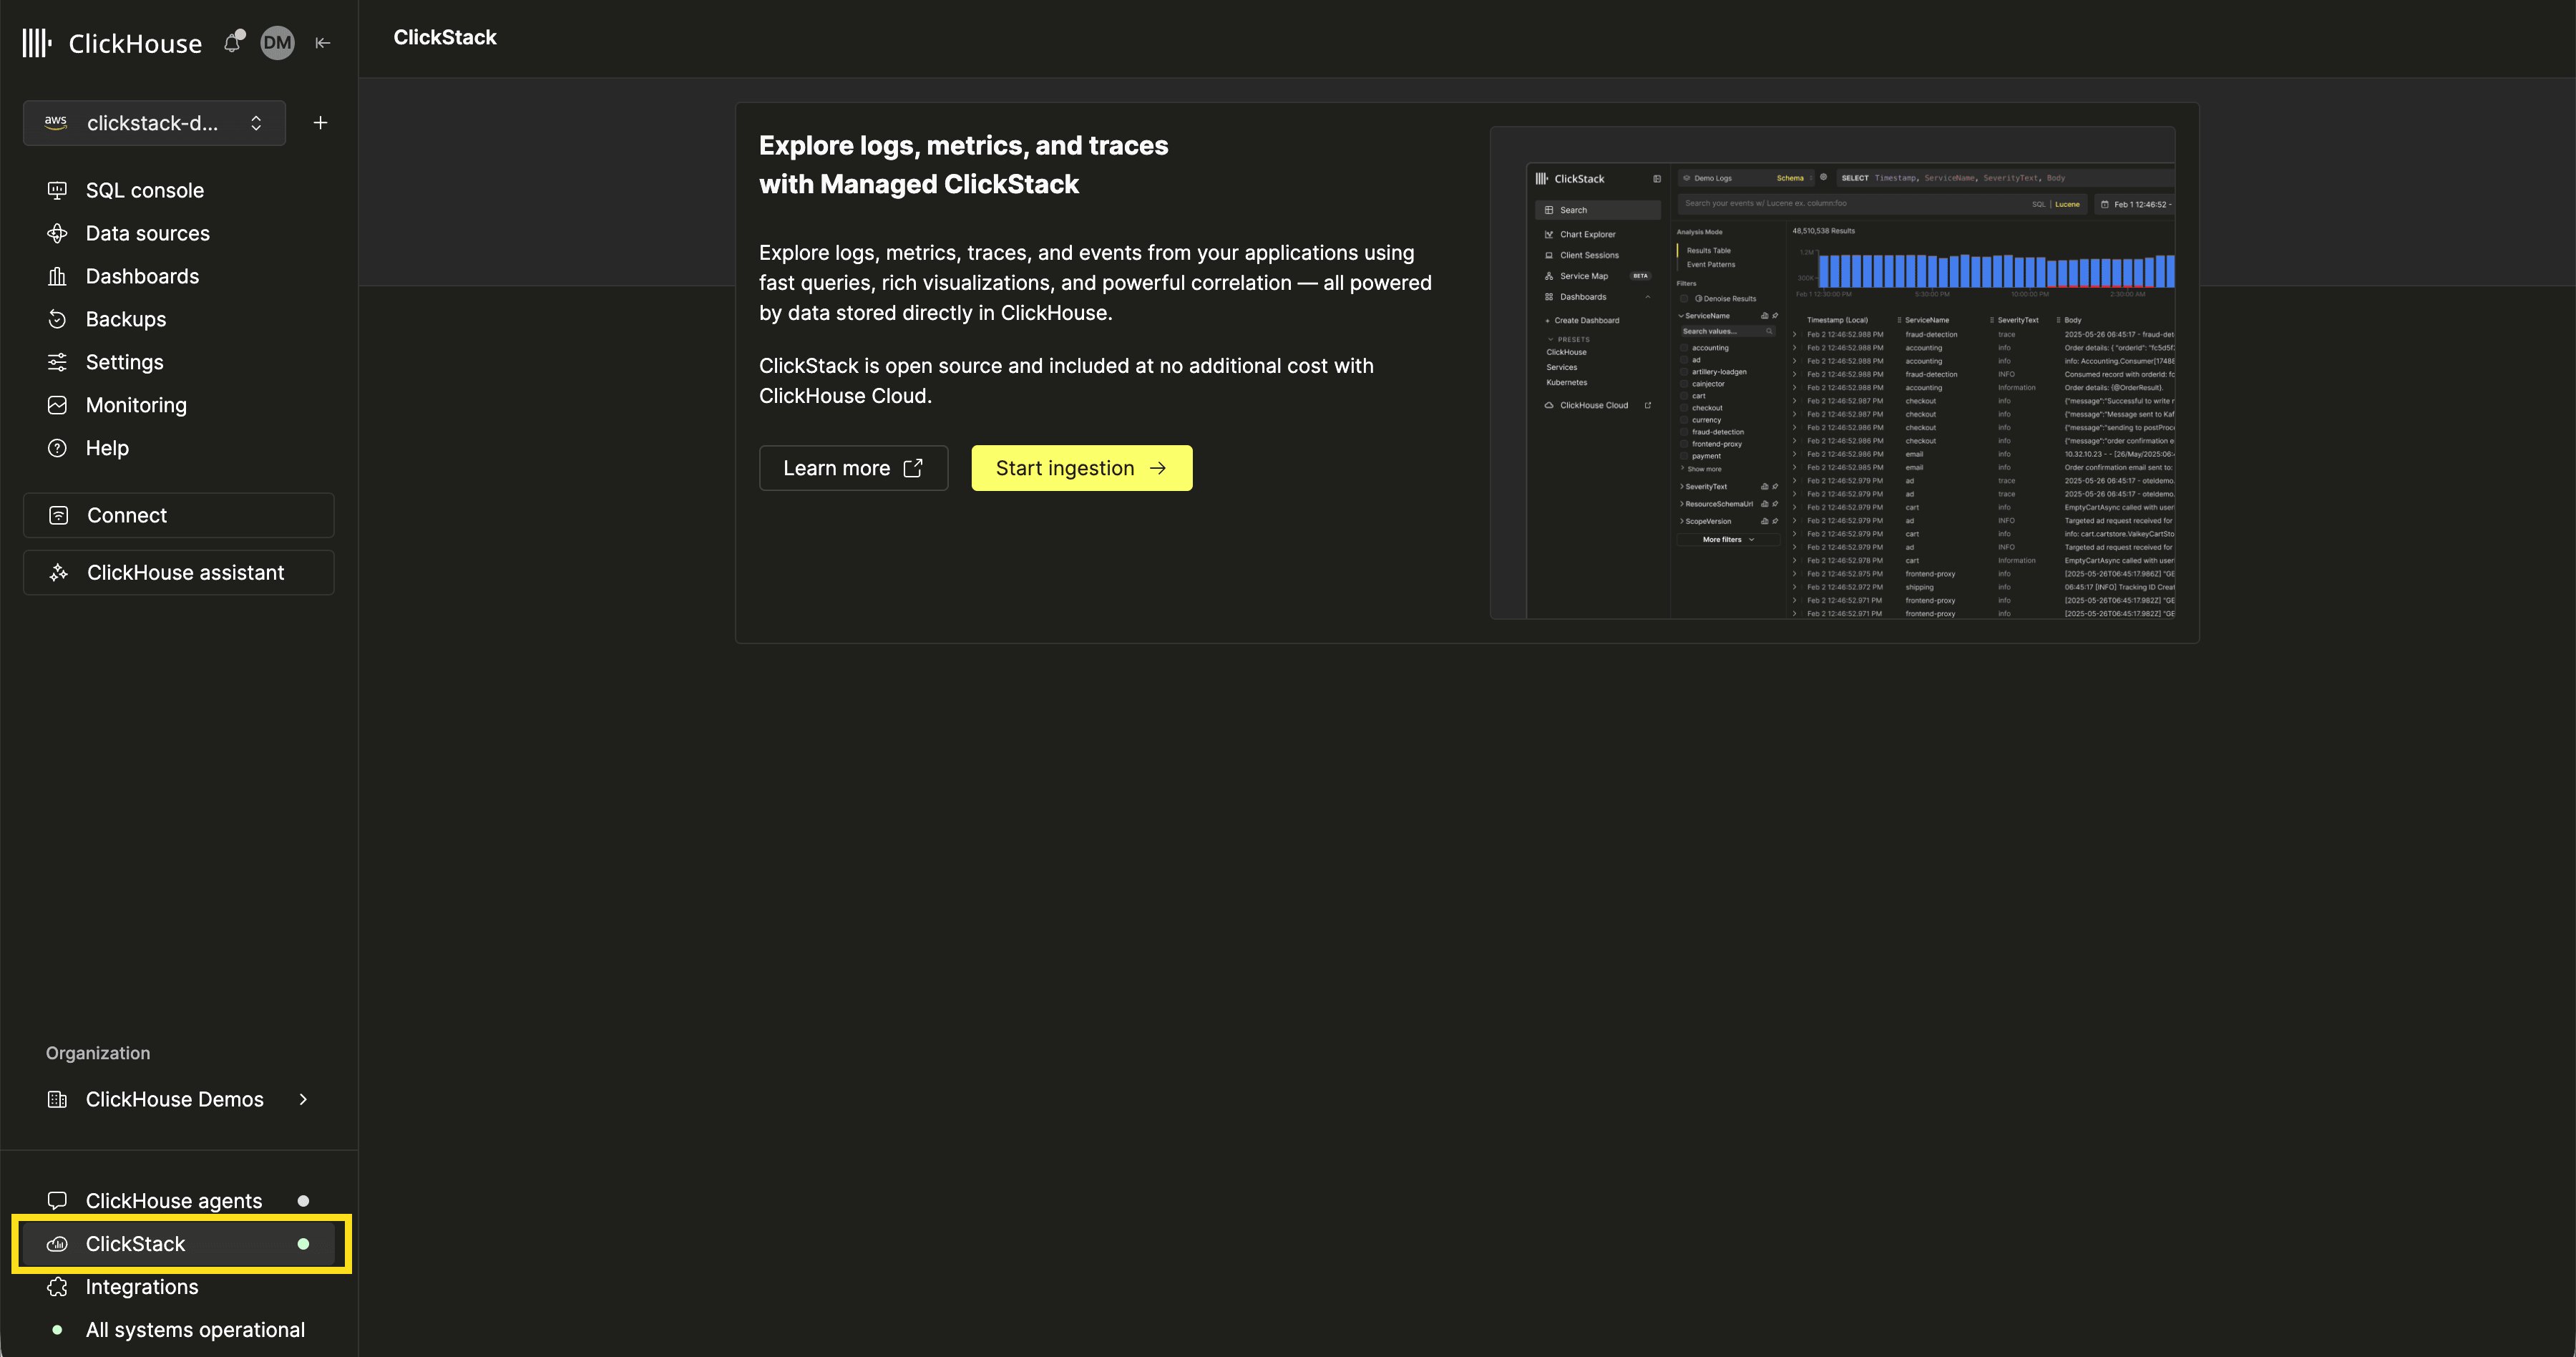
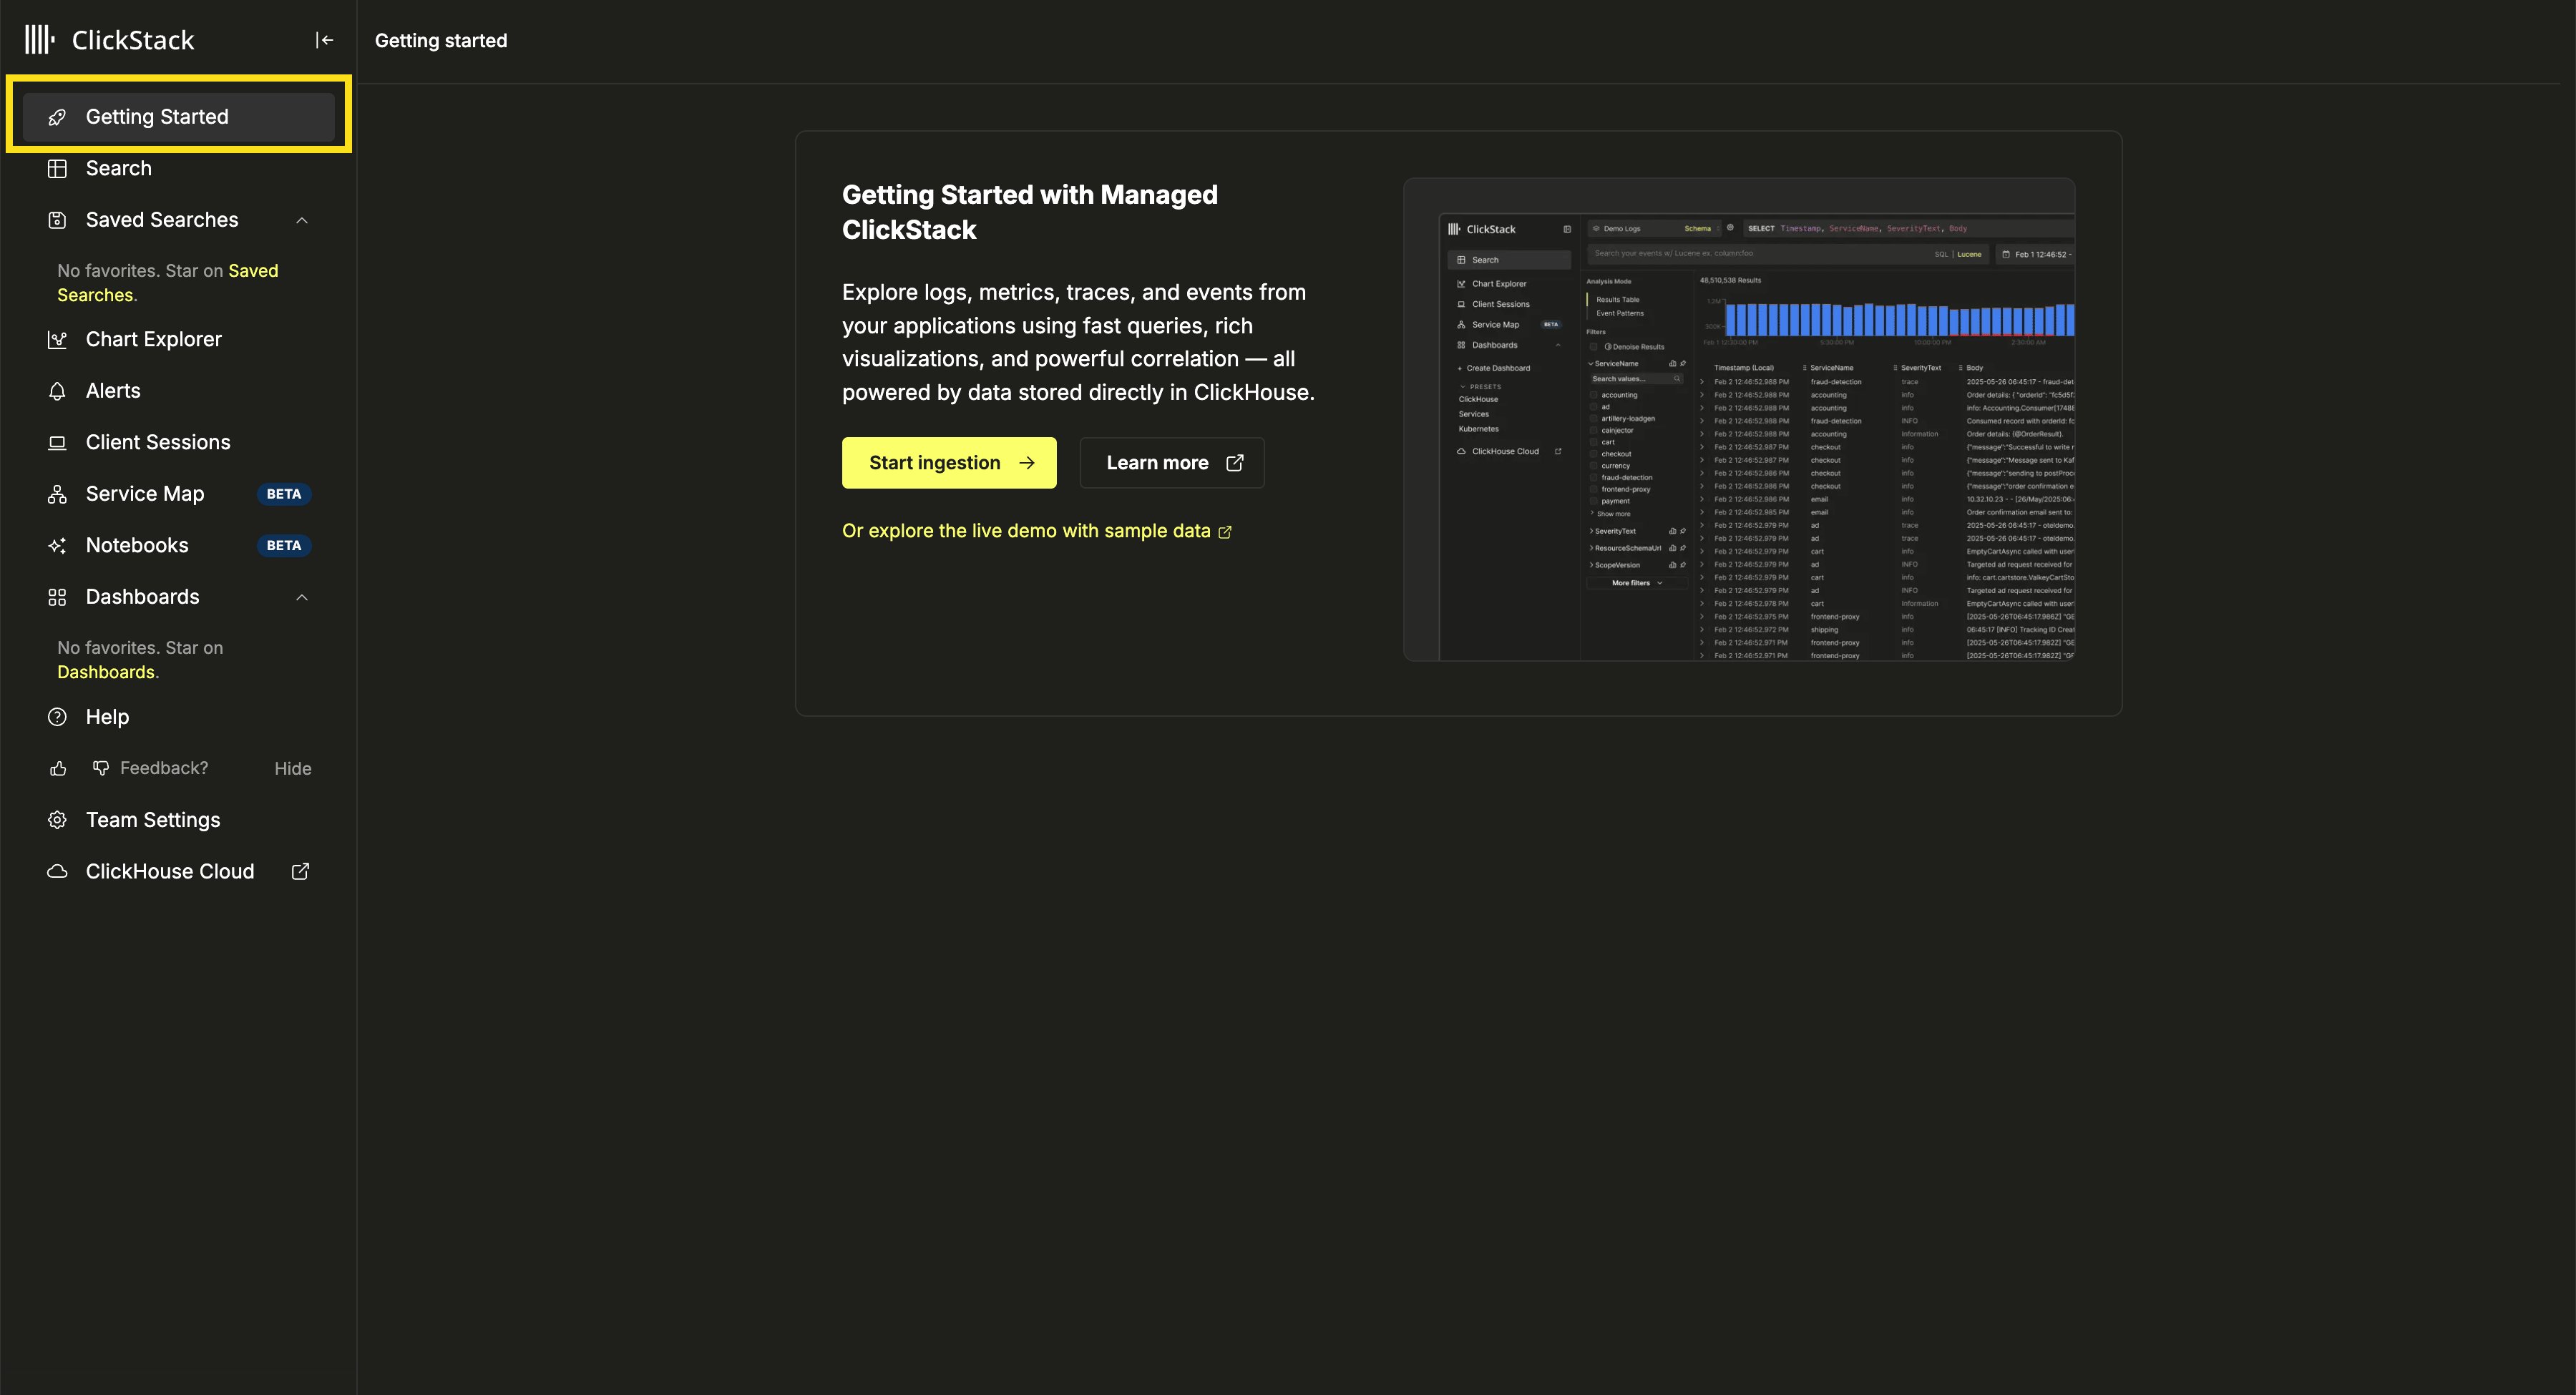
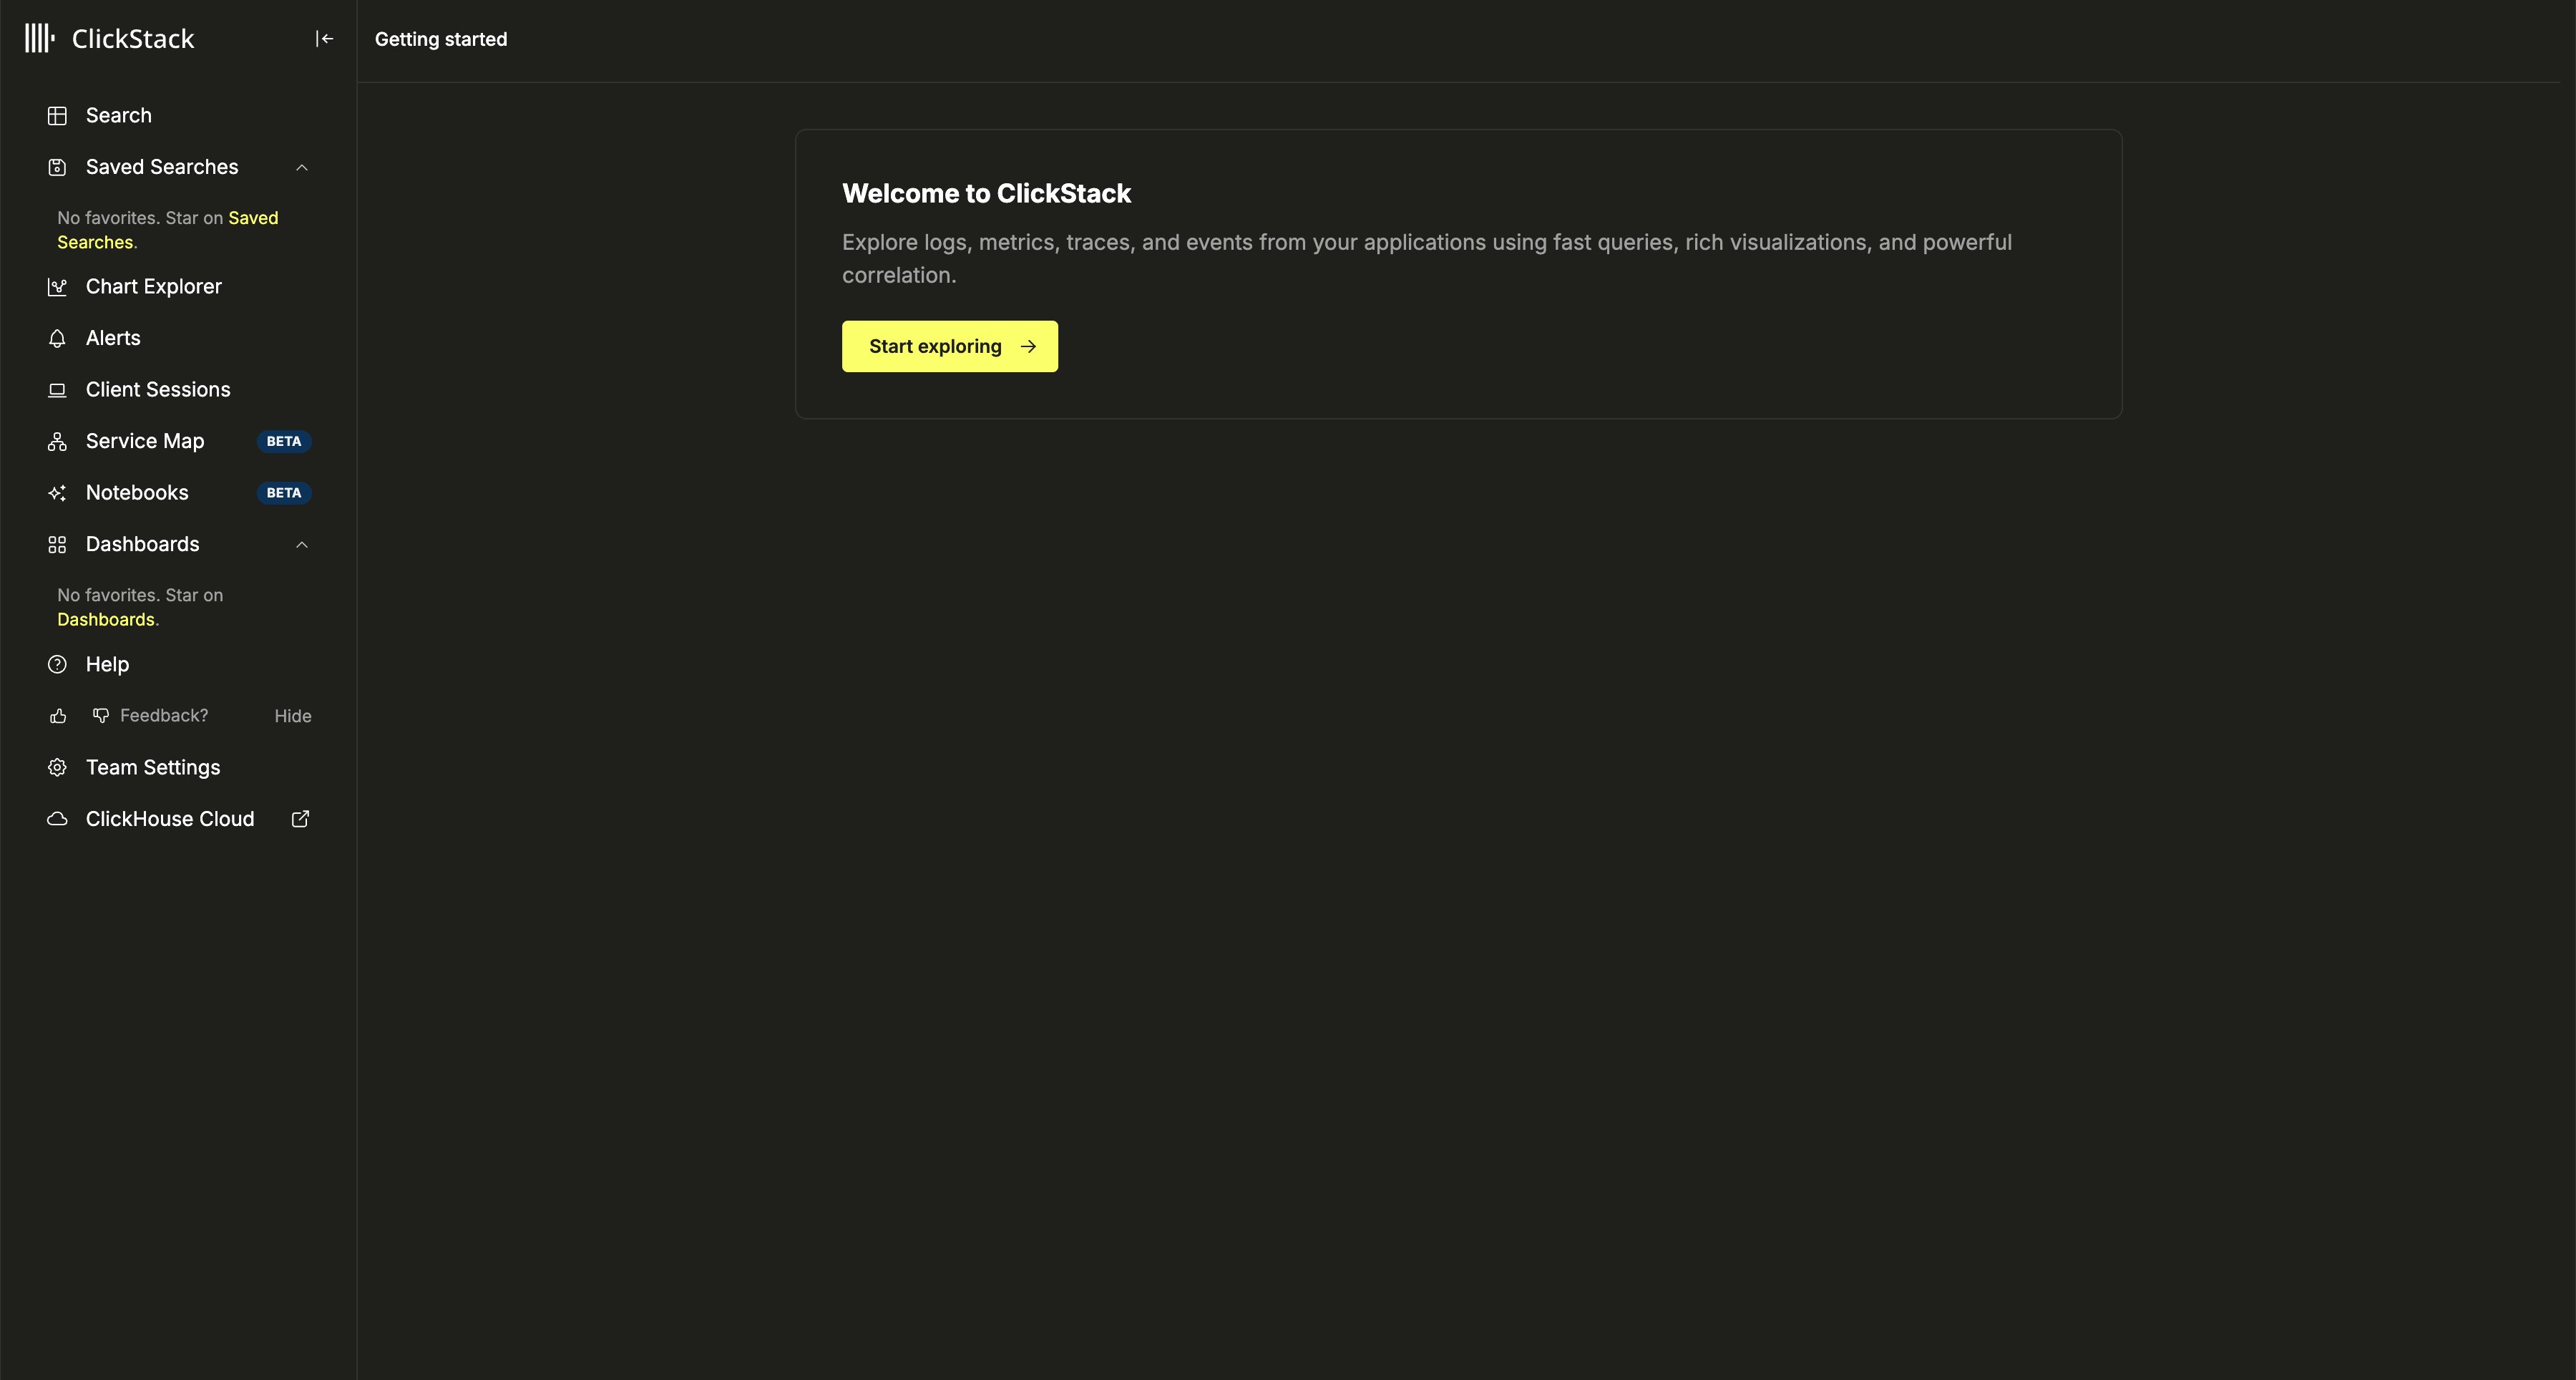
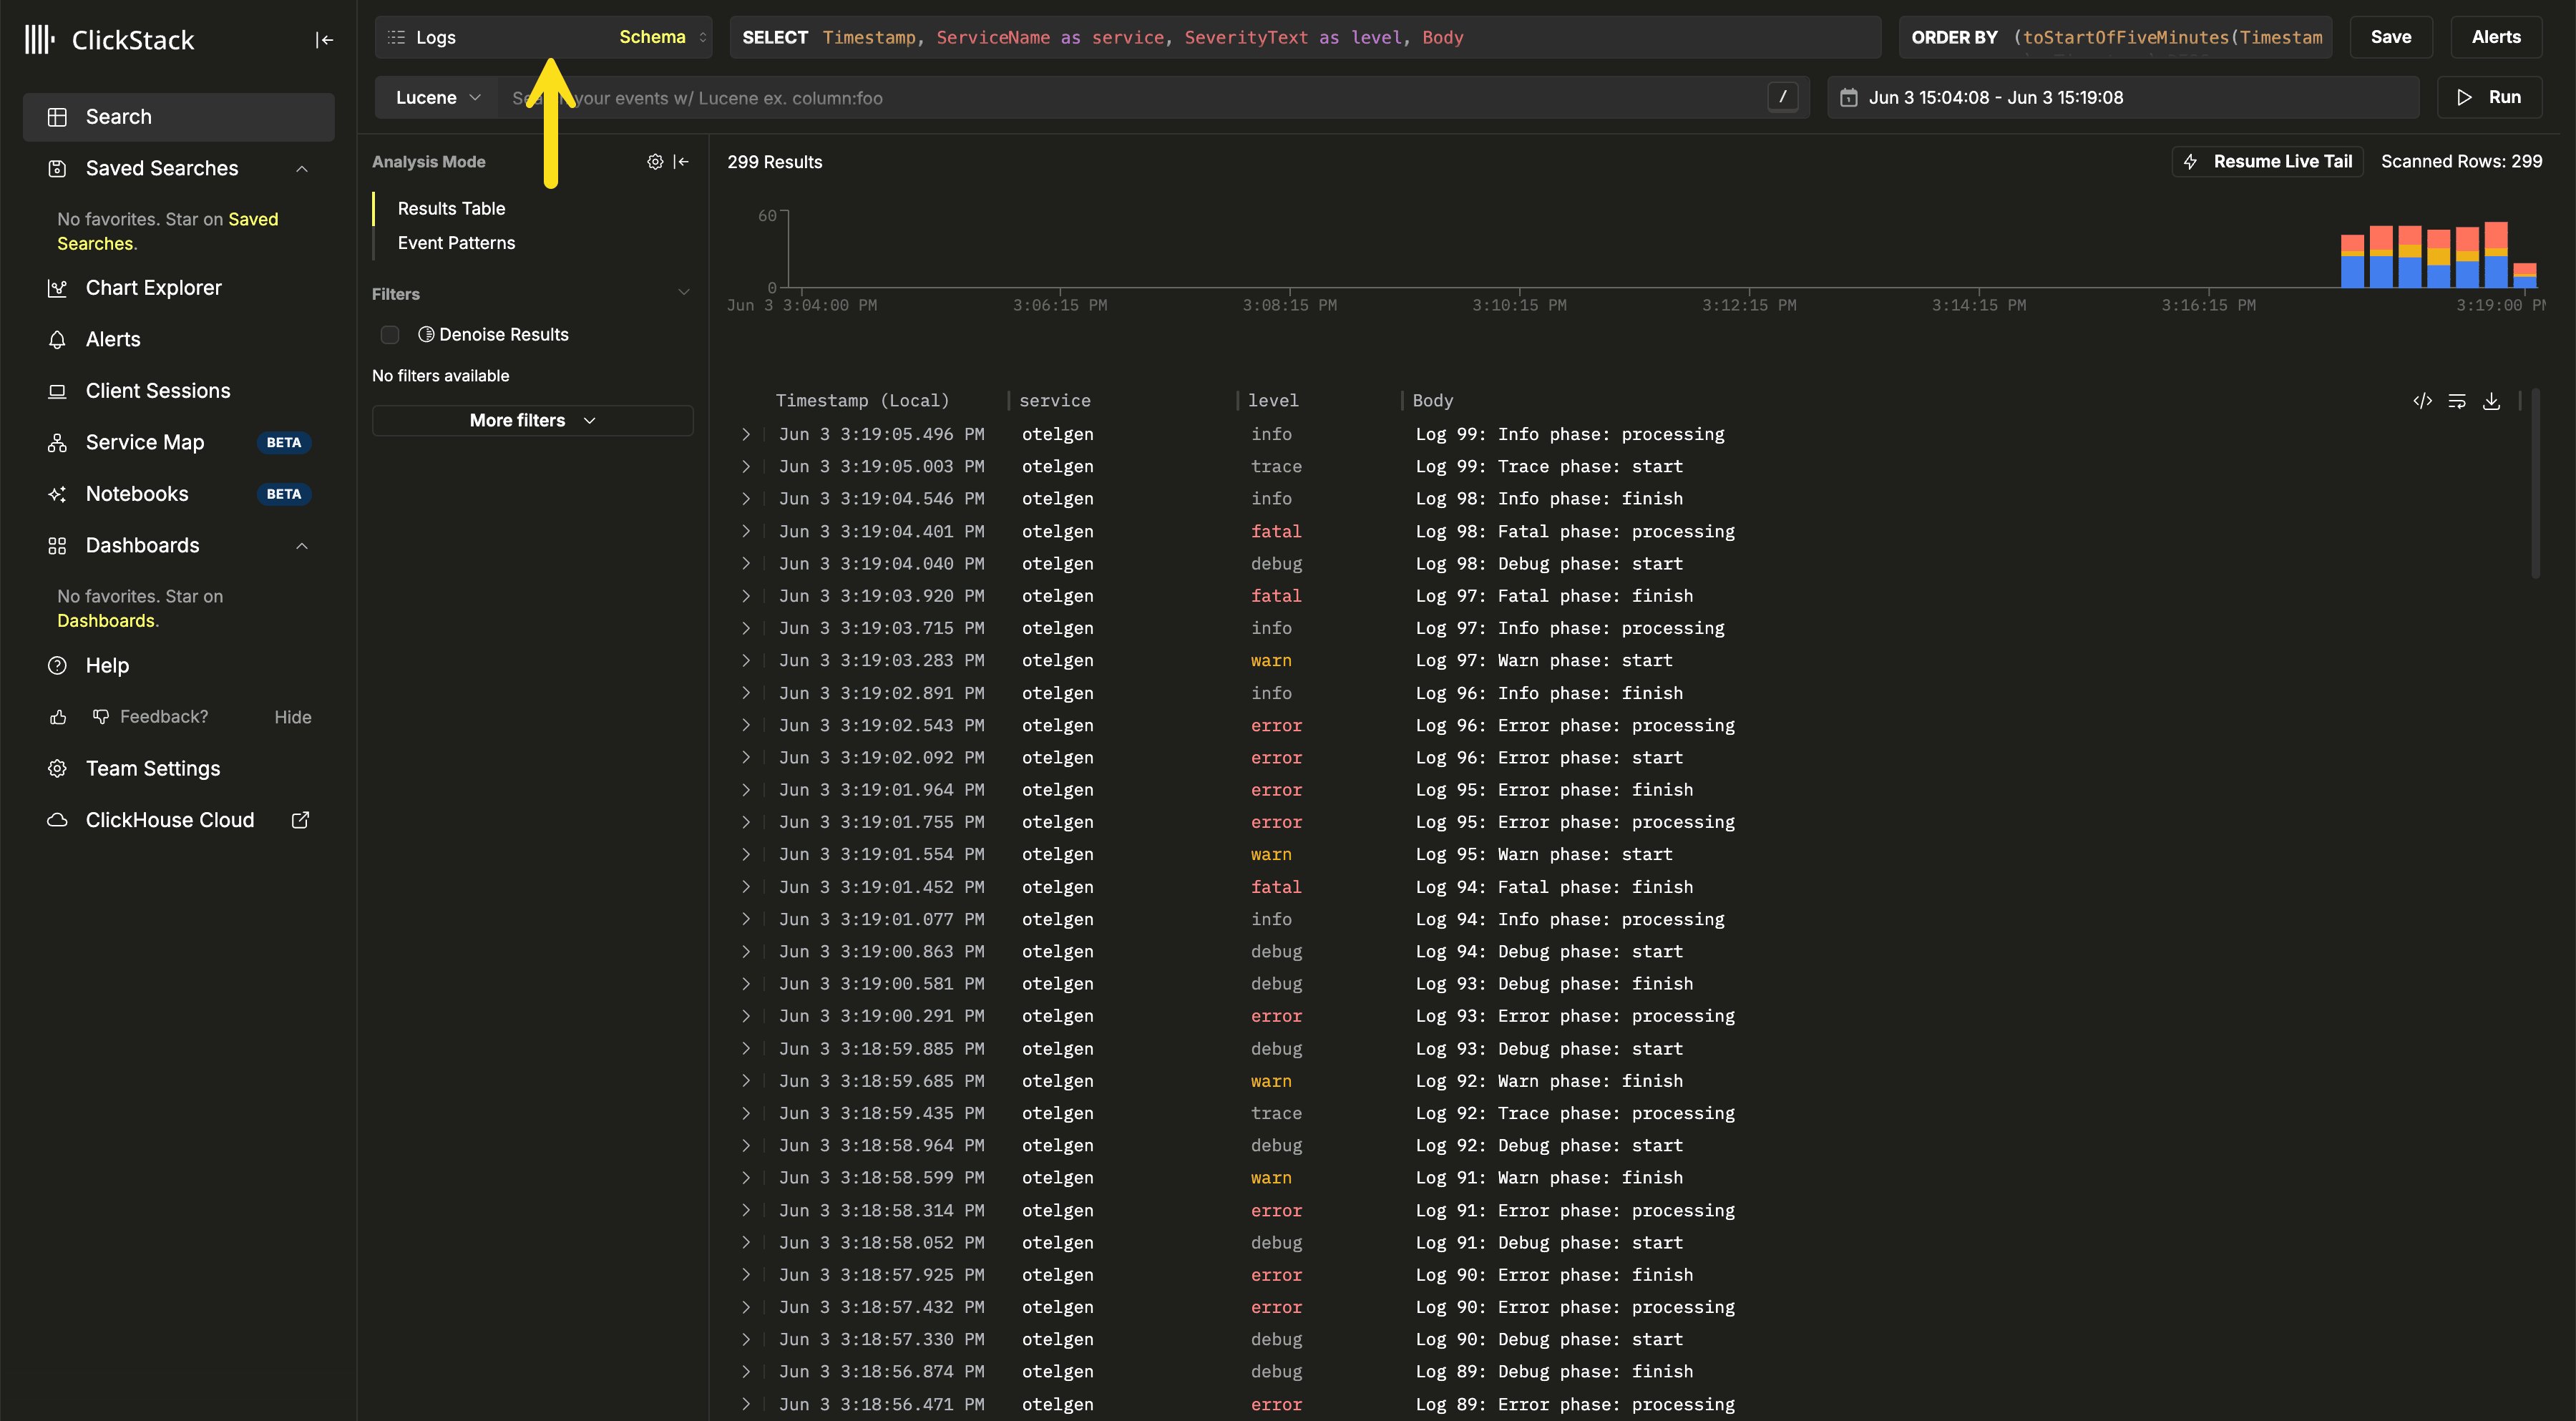
Logs and set the time range to Last 15 minutes. The synthetic logs from telemetrygen should appear within a few seconds.- Confirm the auth header value passed to
telemetrygenmatches the one your collector expects. - Tail your collector’s logs and look for export errors.
- Verify the ClickHouse endpoint configured on the collector includes both the protocol and port (
https://...:8443).
Next steps: send your own data
The synthetic burst above only proves the pipeline works. To start sending real telemetry, instrument your own services with the ClickStack SDKs, which provide instrumentation for Node.js, Python, Go, Java, and other languages that export OTLP to the collector endpoint you just verified. For a complete worked example, follow Instrument an application. To collect from infrastructure rather than application code:- Monitoring Kubernetes: collect logs, infrastructure metrics, and Kubernetes events from a cluster.
- Monitoring AWS CloudWatch logs: forward CloudWatch logs via the OpenTelemetry CloudWatch receiver.
Further reading
This guide covers a single collector instance in its simplest form. The OpenTelemetry collector reference covers what to do next:- Deploying the collector in Kubernetes with the upstream OpenTelemetry Helm chart and the ClickStack collector image.
- Securing the collector with TLS on the OTLP endpoint and least-privilege ingestion users.
- Processing, filtering, and enriching events at the gateway.
- Extending the collector configuration with custom receivers, processors, and pipelines.
- Estimating resources for gateway and agent deployments at your expected throughput.
- Going to production