

Settings for open source distributions
Docker
If using the All in One, ClickStack UI only or Local Mode simply pass the desired setting via an environment variable e.g.Docker Compose
If using the Docker Compose deployment guide, the.env file can be used to modify settings.
Alternatively, explicitly overwrite settings in the docker-compose.yml file e.g.
Example:
Helm
Use the Helm deployment guide to install the operators and ClickStack chart. Retrieve the current chart’s values before customizing a deployment:hyperdx/hdx-oss-v2 chart has a different values structure.
ClickStack UI application
Connections
Configure the database connection used by your sources in Team Settings.Data source settings
The ClickStack UI relies on the user defining a source for each of the Observability data types/pillars:LogsTracesMetricsSessions
Team Settings -> Sources, as shown below for logs:
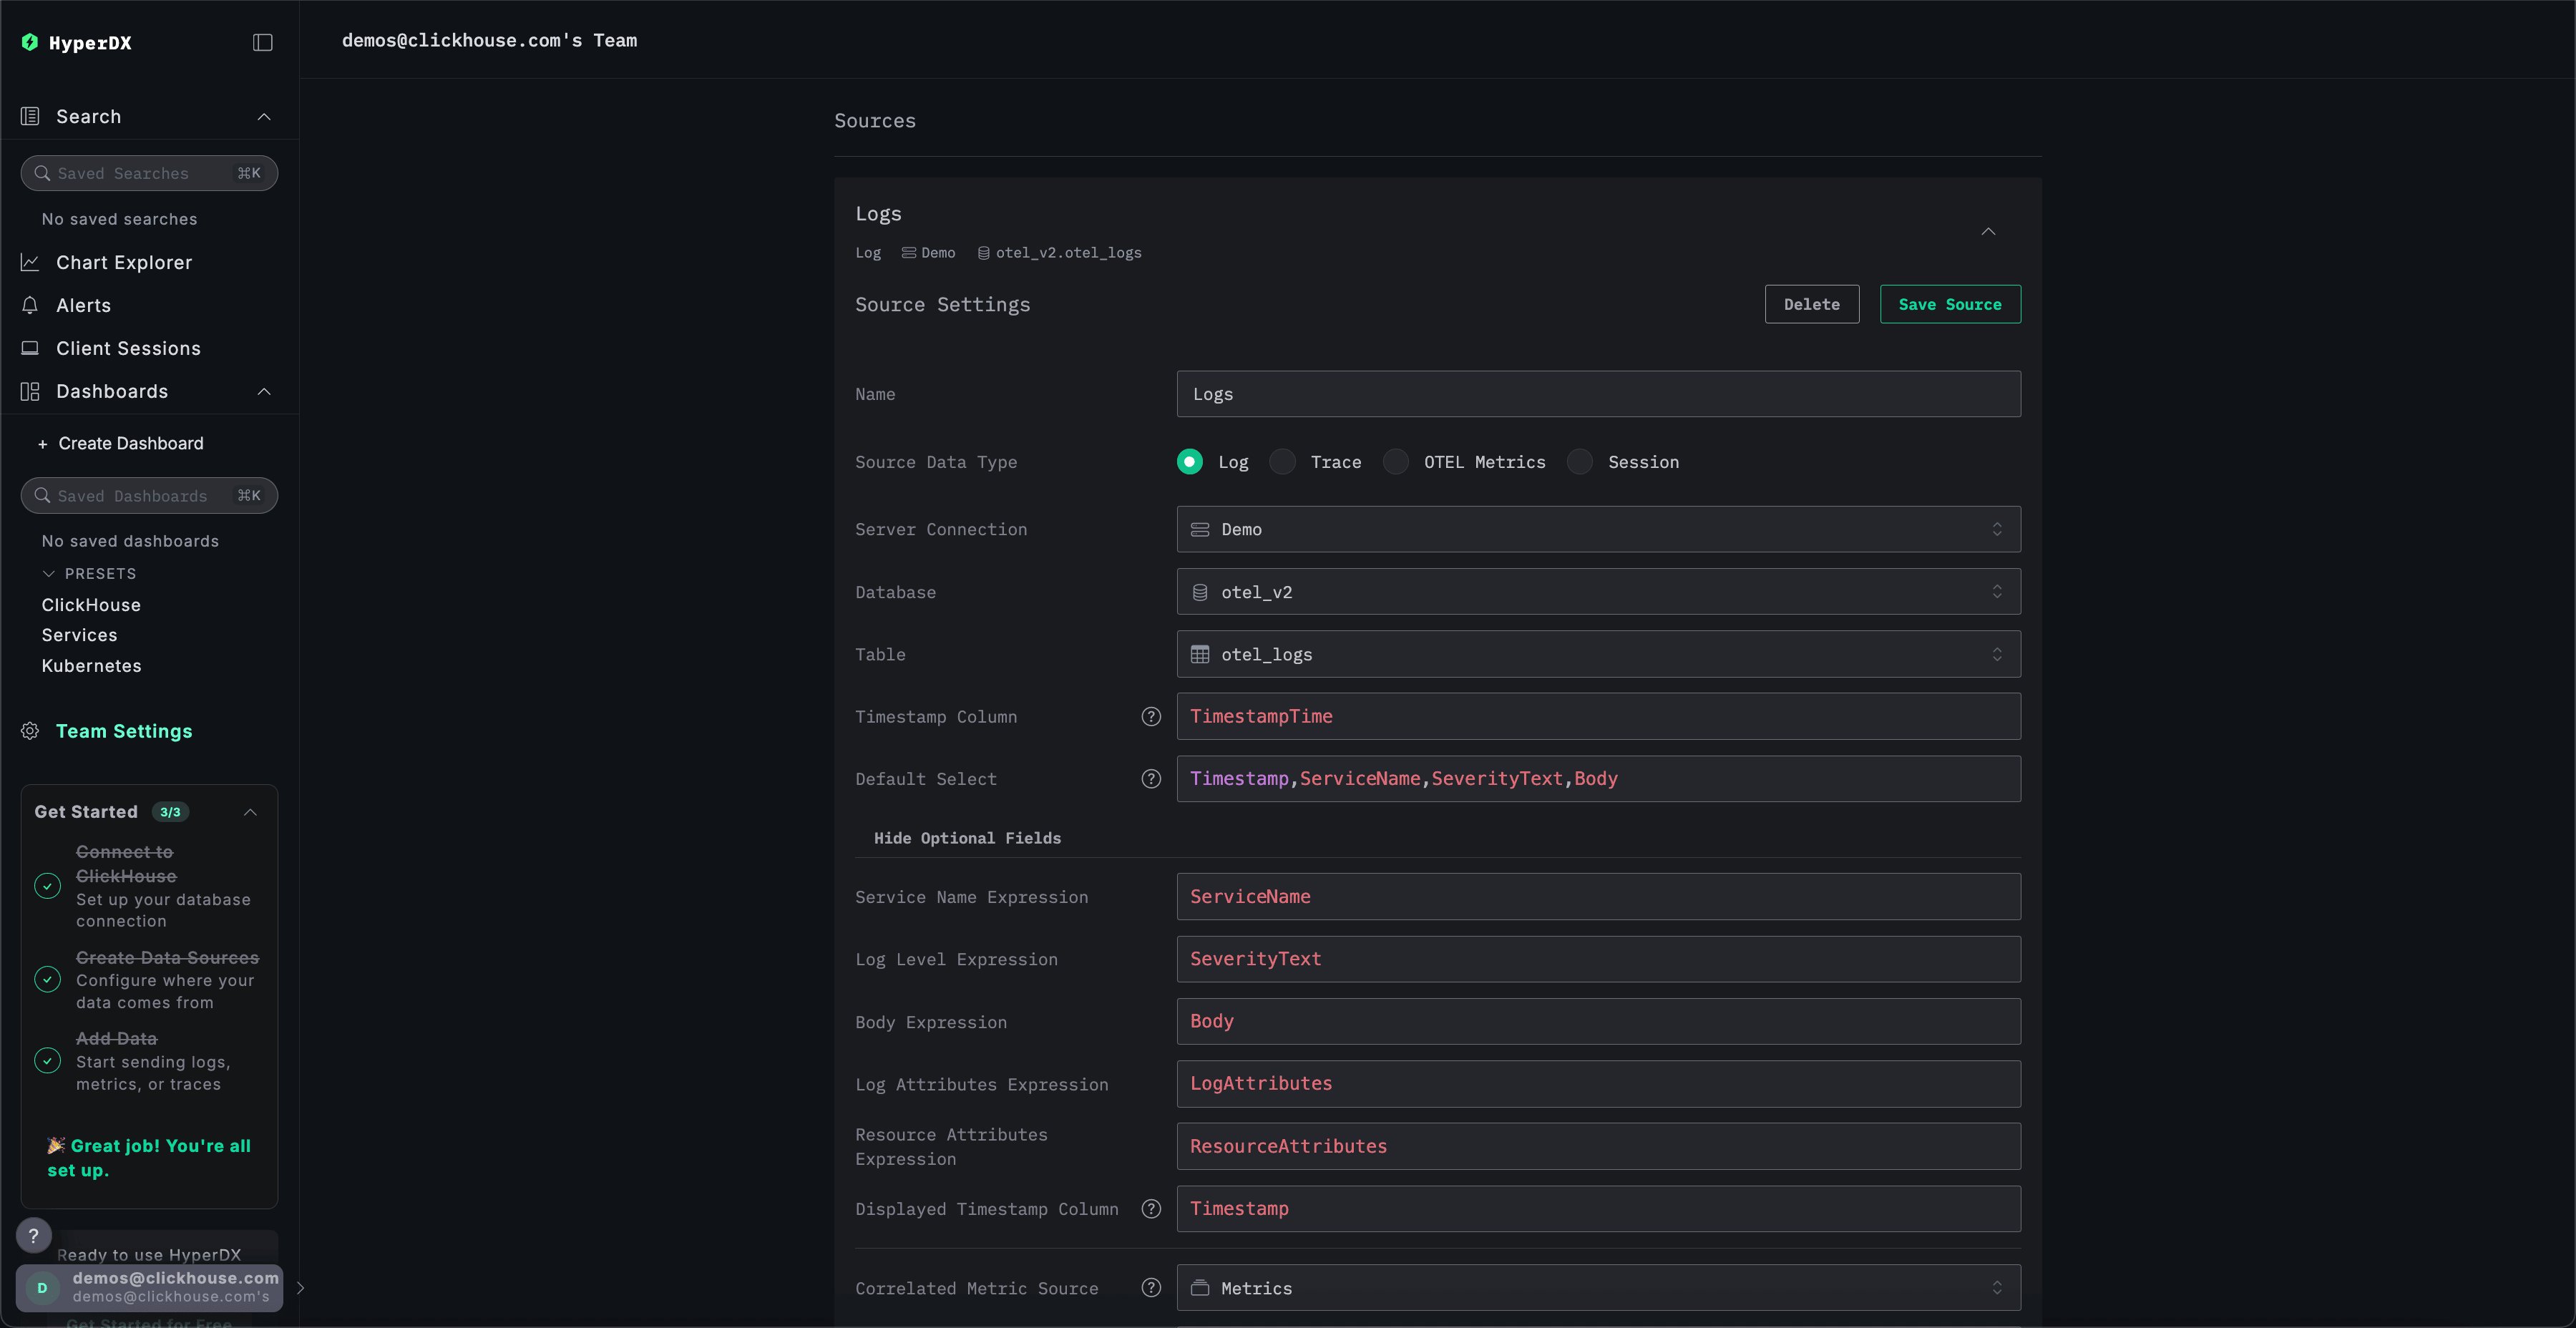
Enabled toggle appears when editing an existing source; source-level Query Settings accept up to ten name/value pairs.
If using the default OpenTelemetry (OTel) schema distributed with ClickStack, these columns can be automatically inferred for each of the sources. If modifying the schema or using a custom schema, users are required to specify and update these mappings.
The collector creates tables through schema migrations or legacy exporter-managed schema creation, depending on its schema configuration. Column mappings follow the OpenTelemetry conventions, including the log data model.
Logs
Traces
Metrics
A metric source also stores its timestamp and resource-attribute mappings (normally
TimeUnix and ResourceAttributes). A unified series Table field is shown only for teams with metrics-series-table support enabled.
PromQL
When PromQL is enabled, you can create a PromQL source. In addition to the common name, connection, database, table, query settings, and enabled fields, it has Minimum auto granularity. For a ClickHouse connection, select theTimeSeries engine table. The timestamp expression is set automatically. Minimum auto granularity also determines the scrape interval used to calculate $__rate_interval; when unset, this assumes a 15-second scrape interval.
Sessions
Materialized views
Materialized views can be registered against Log and Trace data sources so that eligible aggregation queries are answered from the pre-aggregated view instead of the source table. For guidance on creating and registering views, see “Materialized views”. Each registered view is configured with the following settings:
Most of these settings are inferred from the view’s schema when the target table is selected.
Metadata materialized views
Metadata materialized views are materialized views which accelerate field discovery for filters and autocomplete. They can be configured on Log and Trace data sources.Highlighted Attributes
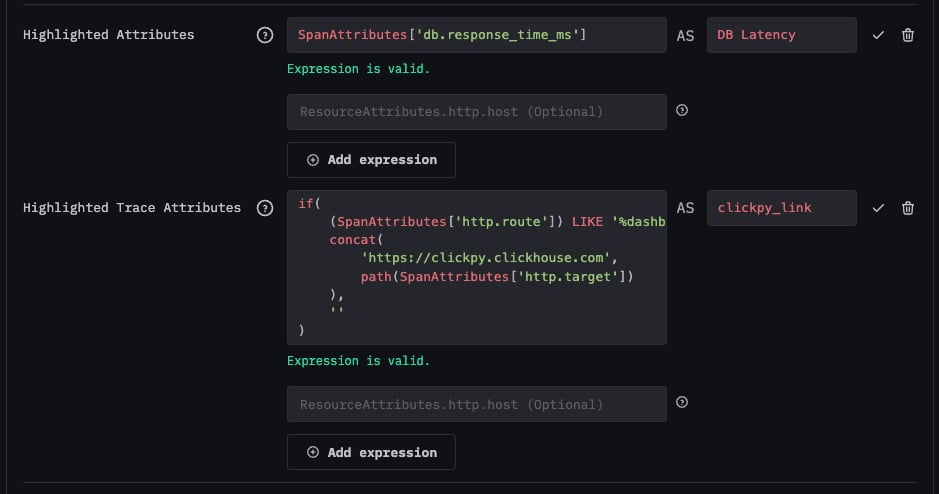
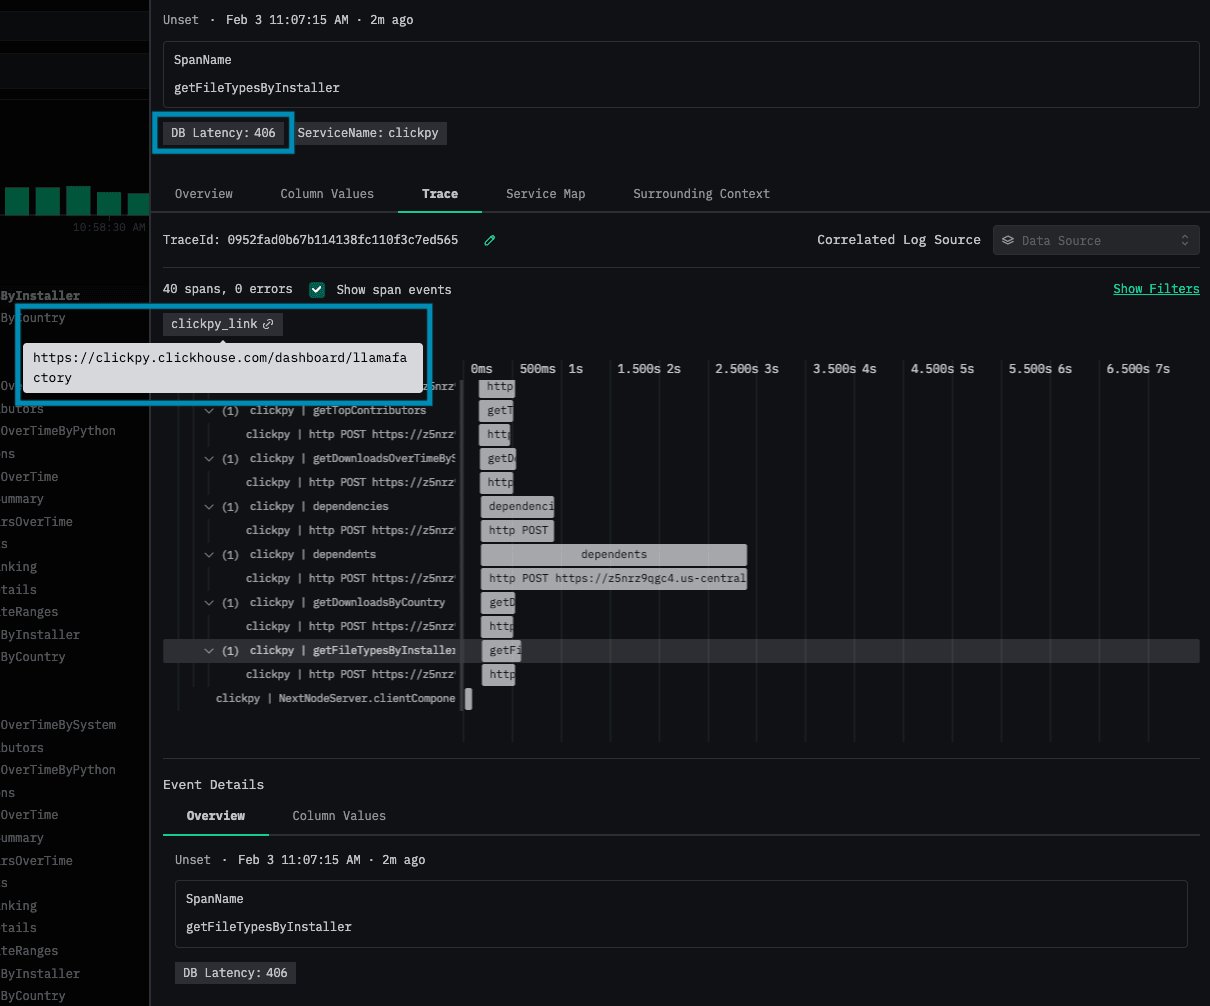
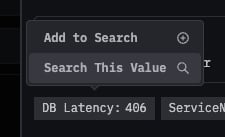
Highlighted Attributes and Highlighted Trace Attributes can be configured on Log and Trace data sources.- Highlighted Attributes are columns or expressions which are displayed for each log or span, when viewing log or span details.
- Highlighted Trace Attributes are columns or expressions which are queried from each log or span in a trace, and displayed above the trace waterfall.
For example, this trace source has been configured with a Highlighted Attribute and a Highlighted Trace Attribute:
Correlated sources
To enable full cross-source correlation in ClickStack, you must configure correlated sources for logs, traces, metrics, and sessions. This allows ClickStack UI to associate related data and provide rich context when rendering events.Logs: Can be correlated with traces and metrics.Traces: Can be correlated with logs, sessions, and metrics.Metrics: Can be correlated with logs.Sessions: Can be correlated with traces.
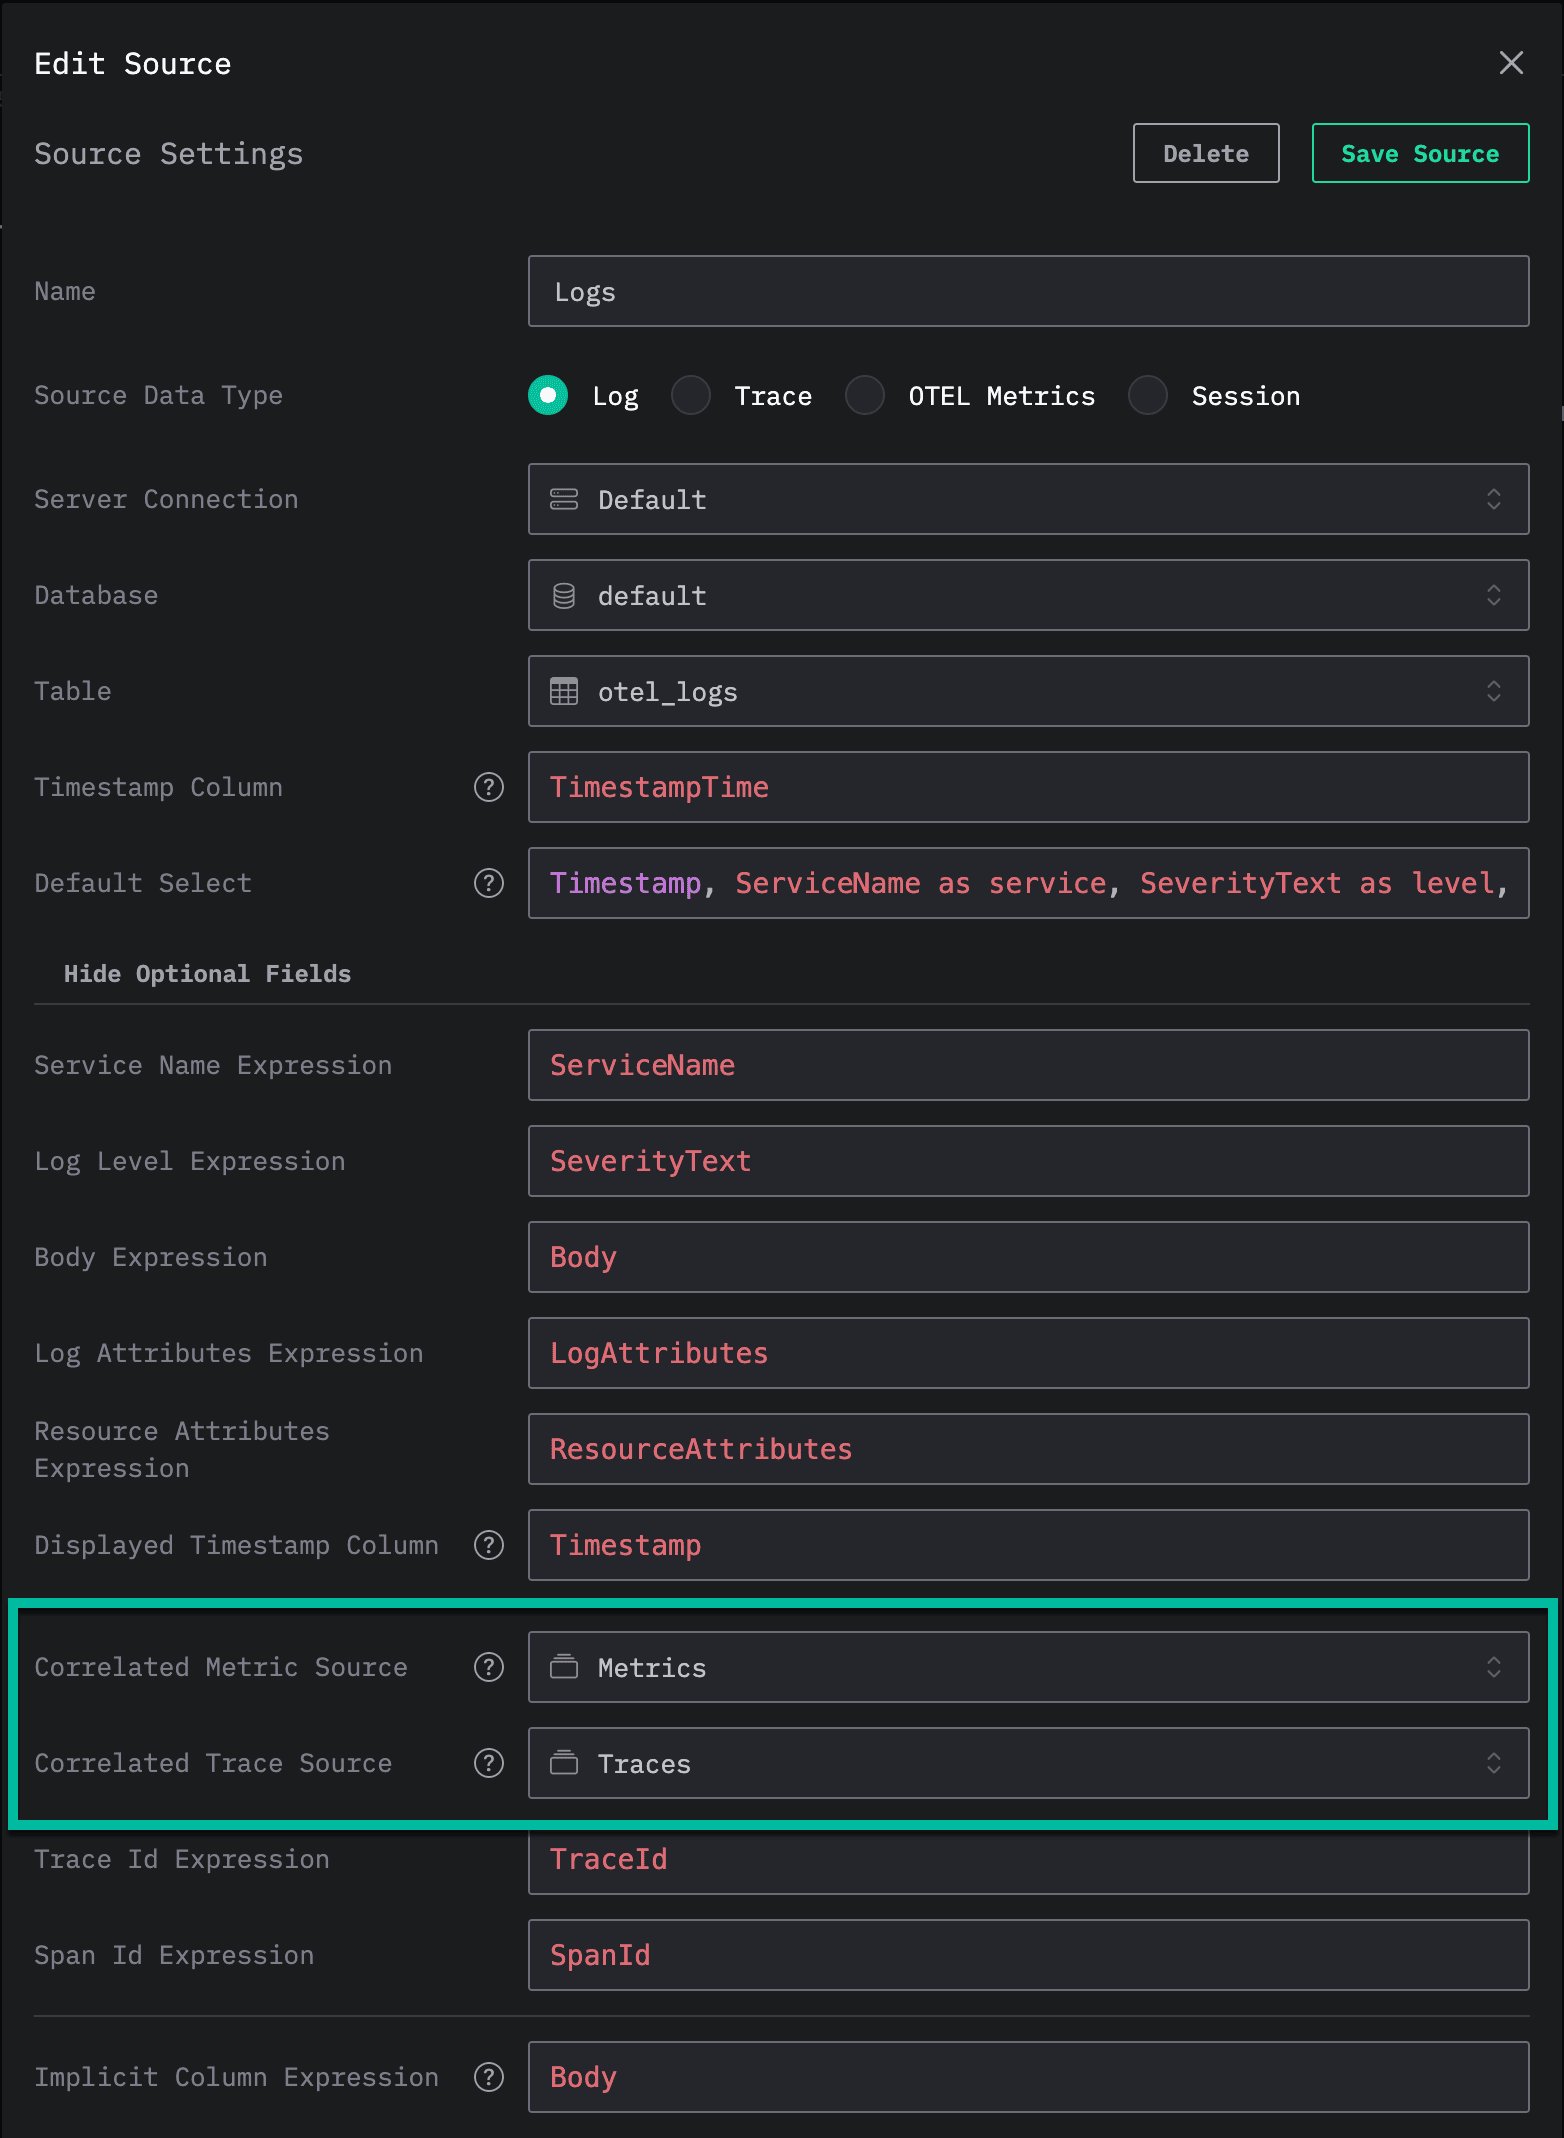
ClickHouse client settings
The ClickHouse Client Settings section in Team Settings controls query behavior for the team.
For permissions and security policies, see Role-based access control. For notification destinations, see Alerts.
Application configuration settings
These environment variables configure self-hosted ClickStack. They aren’t configurable for the hosted ClickStack UI in ClickHouse Cloud. Defaults below refer to the official container entrypoints unless otherwise noted; Docker Compose can override them. Restart the affected service after changing its environment.Network and storage
If running the API directly rather than using the container entrypoint, set
PORT and OPAMP_PORT for the API and OpAMP listeners. The HYPERDX_*_PORT variables are container/deployment conveniences.
Authentication and security
Bootstrap and provisioning
For local-mode deployments,
NEXT_PUBLIC_HDX_LOCAL_DEFAULT_CONNECTIONS and NEXT_PUBLIC_HDX_LOCAL_DEFAULT_SOURCES supply JSON defaults in the browser instead. These values are public: don’t place production credentials in them.
AI assistant
Logging and self-instrumentation
These settings control telemetry emitted by ClickStack itself, not authentication for users or incoming application telemetry.Optional features and deployment modes
NEXT_PUBLIC_IS_LOCAL_MODE is the frontend build flag for the Local Mode distribution. It isn’t a general-purpose development switch. Use the appropriate distribution rather than disabling authentication on an existing deployment. IS_LOCAL_MODE and IS_OSS are application constant names, not the environment variables to set. NEXT_PUBLIC_IS_OSS is a build setting; it isn’t an enterprise-edition switch. MINER_API_URL is no longer used by the current application.
When using the supplied reverse-proxy configuration for a subpath, set HYPERDX_BASE_PATH and NEXT_PUBLIC_HYPERDX_BASE_PATH to the same prefix (for example /clickstack), and include the prefix in FRONTEND_URL.
Some frontend settings are read at build time. In particular, changing NEXT_PUBLIC_HYPERDX_BASE_PATH (the deployment path prefix), NEXT_PUBLIC_NOINDEX (search-engine indexing), or the distribution’s mode flags requires building the frontend with those values. Runtime settings read through next-runtime-env, such as NEXT_PUBLIC_INSTANCE_LABEL, can be supplied to the container at startup.
OpenTelemetry collector
See ClickStack OpenTelemetry Collector for deployment instructions. Set collector variables on the collector container, not just the UI container. In Compose, declaring a value in.env only passes it to a container when docker-compose.yml references it.
Connection and authentication
Without OpAMP, OIDC, or
OTLP_AUTH_TOKEN, the standalone OTLP receiver has no authentication. The ClickHouse account needs permission to insert telemetry and, when schema creation or migrations are enabled, to create or alter the required database objects.
Export, batching, and custom configuration
Schema and retention
The per-signal TTLs and reconciliation setting apply to the migration tool, which is skipped when legacy schema creation is enabled.