
ClickHouse/ClickStack

Explore the code and contribute on GitHub. 10k
ClickStack is an open-source observability platform for SREs, developers, and their AI agents, built on ClickHouse. Search, query, and correlate logs, traces, and metrics alongside session replays in one place. Investigate through the ClickStack UI or connect your own agents through the MCP server. Agents can search telemetry, follow traces, and run SQL against the same data you explore in the UI, using the development tools your team already works with. Rich logs and trace spans preserve request details, custom attributes, and business context as wide events. ClickHouse stores these alongside metrics and session data, so engineers and agents can correlate evidence across services and investigate which requests and customers are affected.
Focus on investigating issues while ClickHouse Observability manages the infrastructure. Sign up for ClickHouse Cloud to get started.

Features

  • Connect your own agents through MCP to search telemetry, investigate failures, and manage dashboards and alerts
  • Search and correlate logs, metrics, session replays, and traces in the ClickStack UI
  • Schema agnostic, works on top of your existing ClickHouse schema
  • Run fast searches and aggregations across high-cardinality telemetry
  • Use full-text search and Lucene-style filters such as level:err, or SQL for deeper analysis
  • Set up alerts in just a few clicks
  • Dashboard high cardinality events without a complex query language
  • Native JSON string querying
  • Live tail logs and traces to always get the freshest events
  • OpenTelemetry (OTel) supported out of the box
  • Monitor health and performance from HTTP requests to DB queries (APM)
  • Event deltas for identifying anomalies and performance regressions
  • Log pattern recognition
  • Open ClickStack pages directly with deep links using URL query parameters

Components

ClickStack consists of three core components:
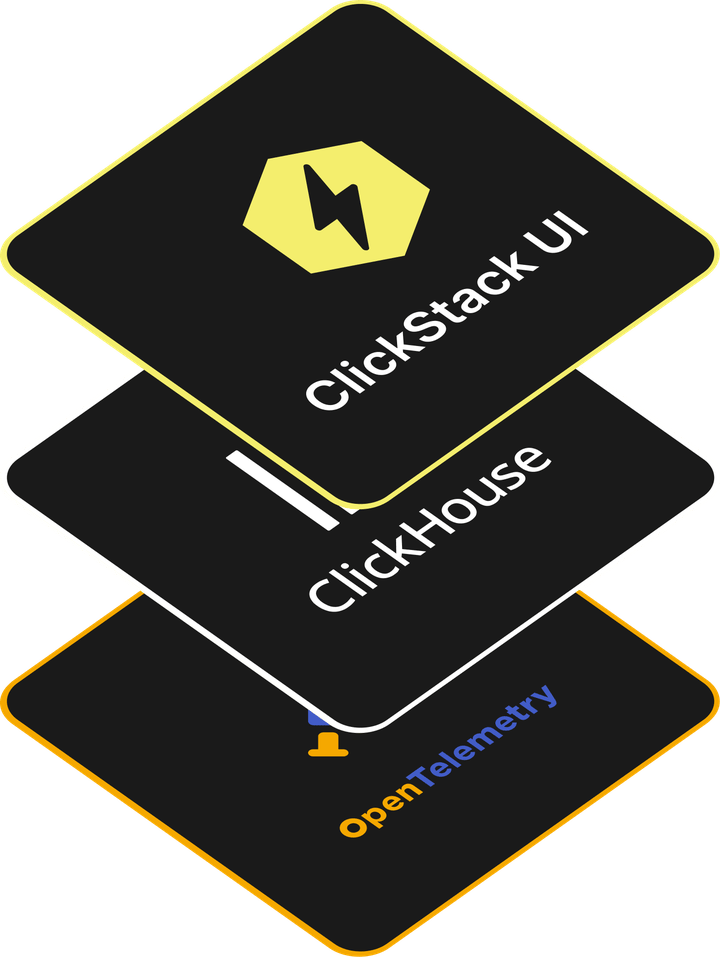
ClickStack's three layers: ClickStack UI on top, ClickHouse for storage and querying in the middle, and OpenTelemetry for collection at the base.
  1. ClickStack UI – a purpose-built frontend for exploring and visualizing observability data
  2. ClickHouse – the high-performance analytical database at the heart of the stack
  3. OpenTelemetry collector – a custom-built, preconfigured collector with an opinionated schema for logs, traces, and metrics
These components can be deployed together in a fully self-managed ClickStack Open Source setup. See the architecture guide for how they fit together and how application state is stored. A browser-hosted version of the ClickStack UI is also available, allowing users to connect directly to existing ClickHouse deployments without deploying additional UI infrastructure. To get started, visit the Getting started guide before loading a sample dataset. You can also explore documentation on deployment options and production best practices.

Principles

Bring your own agents

AI-assisted investigation is a core workflow in ClickStack. Connect your preferred agents through the MCP server to search logs, follow traces, and explore your telemetry without leaving your development environment. Investigation tools support common tasks, while SQL lets agents correlate evidence and explore questions beyond predefined dashboards. You choose the agents and models; ClickStack provides access to the same telemetry and investigation tools available to your team.

Easy to set up in minutes

ClickStack works out of the box with any ClickHouse instance and schema, requiring minimal configuration. Whether you’re starting fresh or integrating with an existing setup, you can be up and running in minutes.

User-friendly and purpose-built

The ClickStack UI brings search, trace exploration, charts, dashboards, and alerts together. Use Lucene-style filters and visual query builders for everyday questions, then turn to SQL when you need more control over the analysis. Engineers and agents work with the same data, so you can inspect the evidence behind an investigation.

End-to-end observability

Connect frontend session replays with application logs, distributed traces, and metrics to follow failures across your system. Wide events keep request details, custom attributes, and business context together in logs and trace spans, helping you identify which requests, services, and customers are affected.

Built for ClickHouse

ClickHouse’s columnar storage, compression, and parallel query execution support fast searches and aggregations across large volumes of high-cardinality telemetry. Concurrent queries let engineers and agents investigate the same data in parallel.

OpenTelemetry-native

ClickStack is natively integrated with OpenTelemetry, ingesting all data through an OpenTelemetry collector endpoint. For advanced users, it also supports direct ingestion into ClickHouse using native file formats, custom pipelines, or third-party tools like Vector.

Open source and fully customizable

ClickStack is fully open source and can be deployed anywhere. The schema is flexible and user-modifiable, and the UI is designed to be configurable to custom schemas without requiring changes. All components—including collectors, ClickHouse, and the UI - can be scaled independently to meet ingestion, query, or storage demands.