ビデオ / ClickStack
An intro to observability
Mark Needham
Are you tired of managing three separate systems for logs, metrics, and traces? This video explores the traditional three-pillar approach to observability and introduces a simpler, more unified alternative.
We start with the classic observability setup - logs stored in Elasticsearch with search UIs, metrics aggregated in Prometheus with Grafana dashboards, and traces collected in systems like Zipkin with Cassandra backends. While this approach works, it creates artificial boundaries that complicate debugging and increase operational overhead.
- Traditional observability challenges - Managing separate storage systems, UIs, and collection agents
- The debugging problem - Manually stitching together data from disconnected systems during incidents
- Wide events approach - Ivan Bermiskov's insight that unified event data can replace the three-pillar model
- Simplified architecture - Single column store, unified UI, and consolidated data collection
Instead of maintaining three separate systems, we explore how a column store that supports semi-structured data can handle logs, metrics, and traces together. This unified approach reduces complexity while maintaining the observability insights you need.
We also tease the ClickStack as one opinionated, open-source solution that provides all these components in a cohesive package.
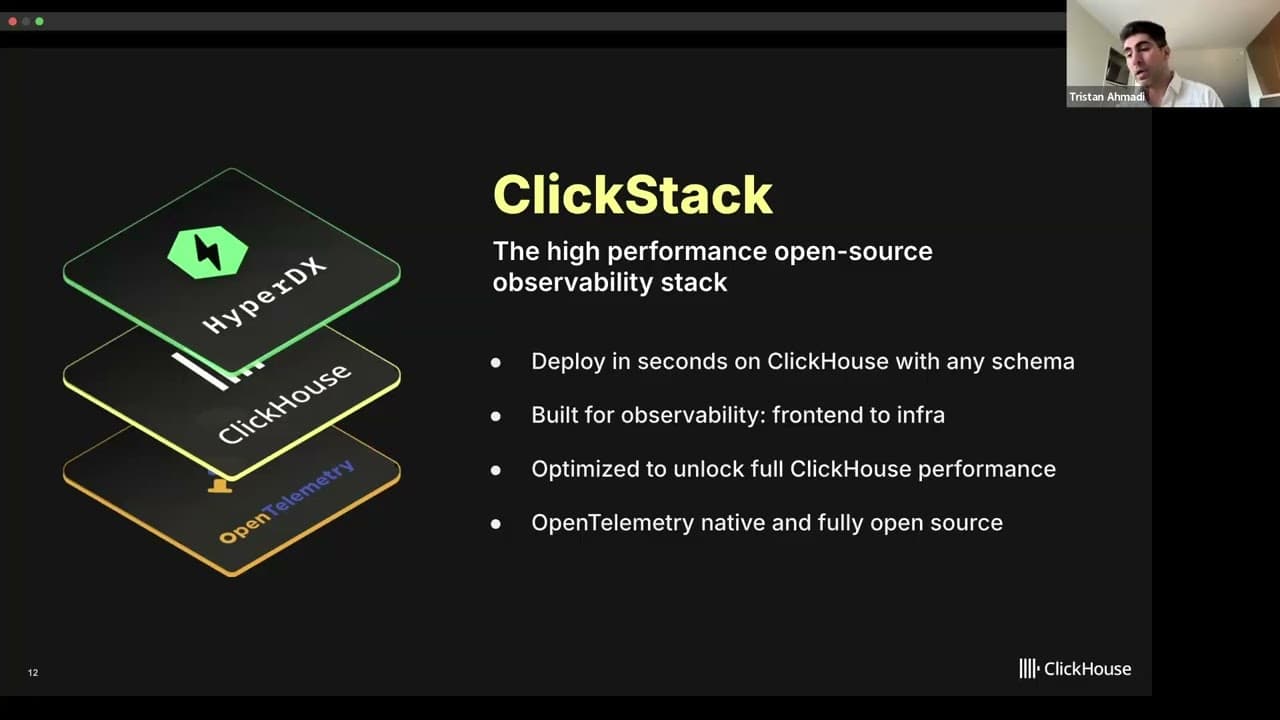
Introducing ClickStack: The Future of Observability on ClickHouse
Tristan Ahmadi, Solution Architect, ClickHouse

Moderniser l’observabilité avec ClickStack : simplifier, accélérer, innover
L’observabilité n’a jamais été aussi critique… ni aussi complexe. Êtes-vous prêt à transformer votre manière de gérer la complexité des systèmes distribués ? Découvrez comment ClickHouse révolutionne l’observabilité moderne en combinant rapidité, efficacité et ouverture.
Open House NYC: Observability Deep Dive
Mike Shi, Principal Product Manager at ClickHouse