

Prerequisites
- A running Kubernetes cluster with capacity for the collectors and, if used, the demo application.
- A ClickHouse Observability service. See the fully managed getting started guide or the self-managed getting started guide.
- Helm v3+.
kubectl, configured to interact with your cluster, with permission to create namespaces, Secrets, ConfigMaps, and cluster roles.- Network access from your collectors to the endpoint for your chosen deployment.
Demo application
If you already have workloads to monitor, skip the demo deployment and continue to Configure collection. The ClickStack fork of the OpenTelemetry Demo provides an e-commerce application with instrumented microservices and generated traffic.Demo Architecture
The demo is composed of microservices written in different programming languages that talk to each other over gRPC and HTTP and a load generator that uses Locust to fake user traffic. The original source code for this demo has been modified to use ClickStack instrumentation.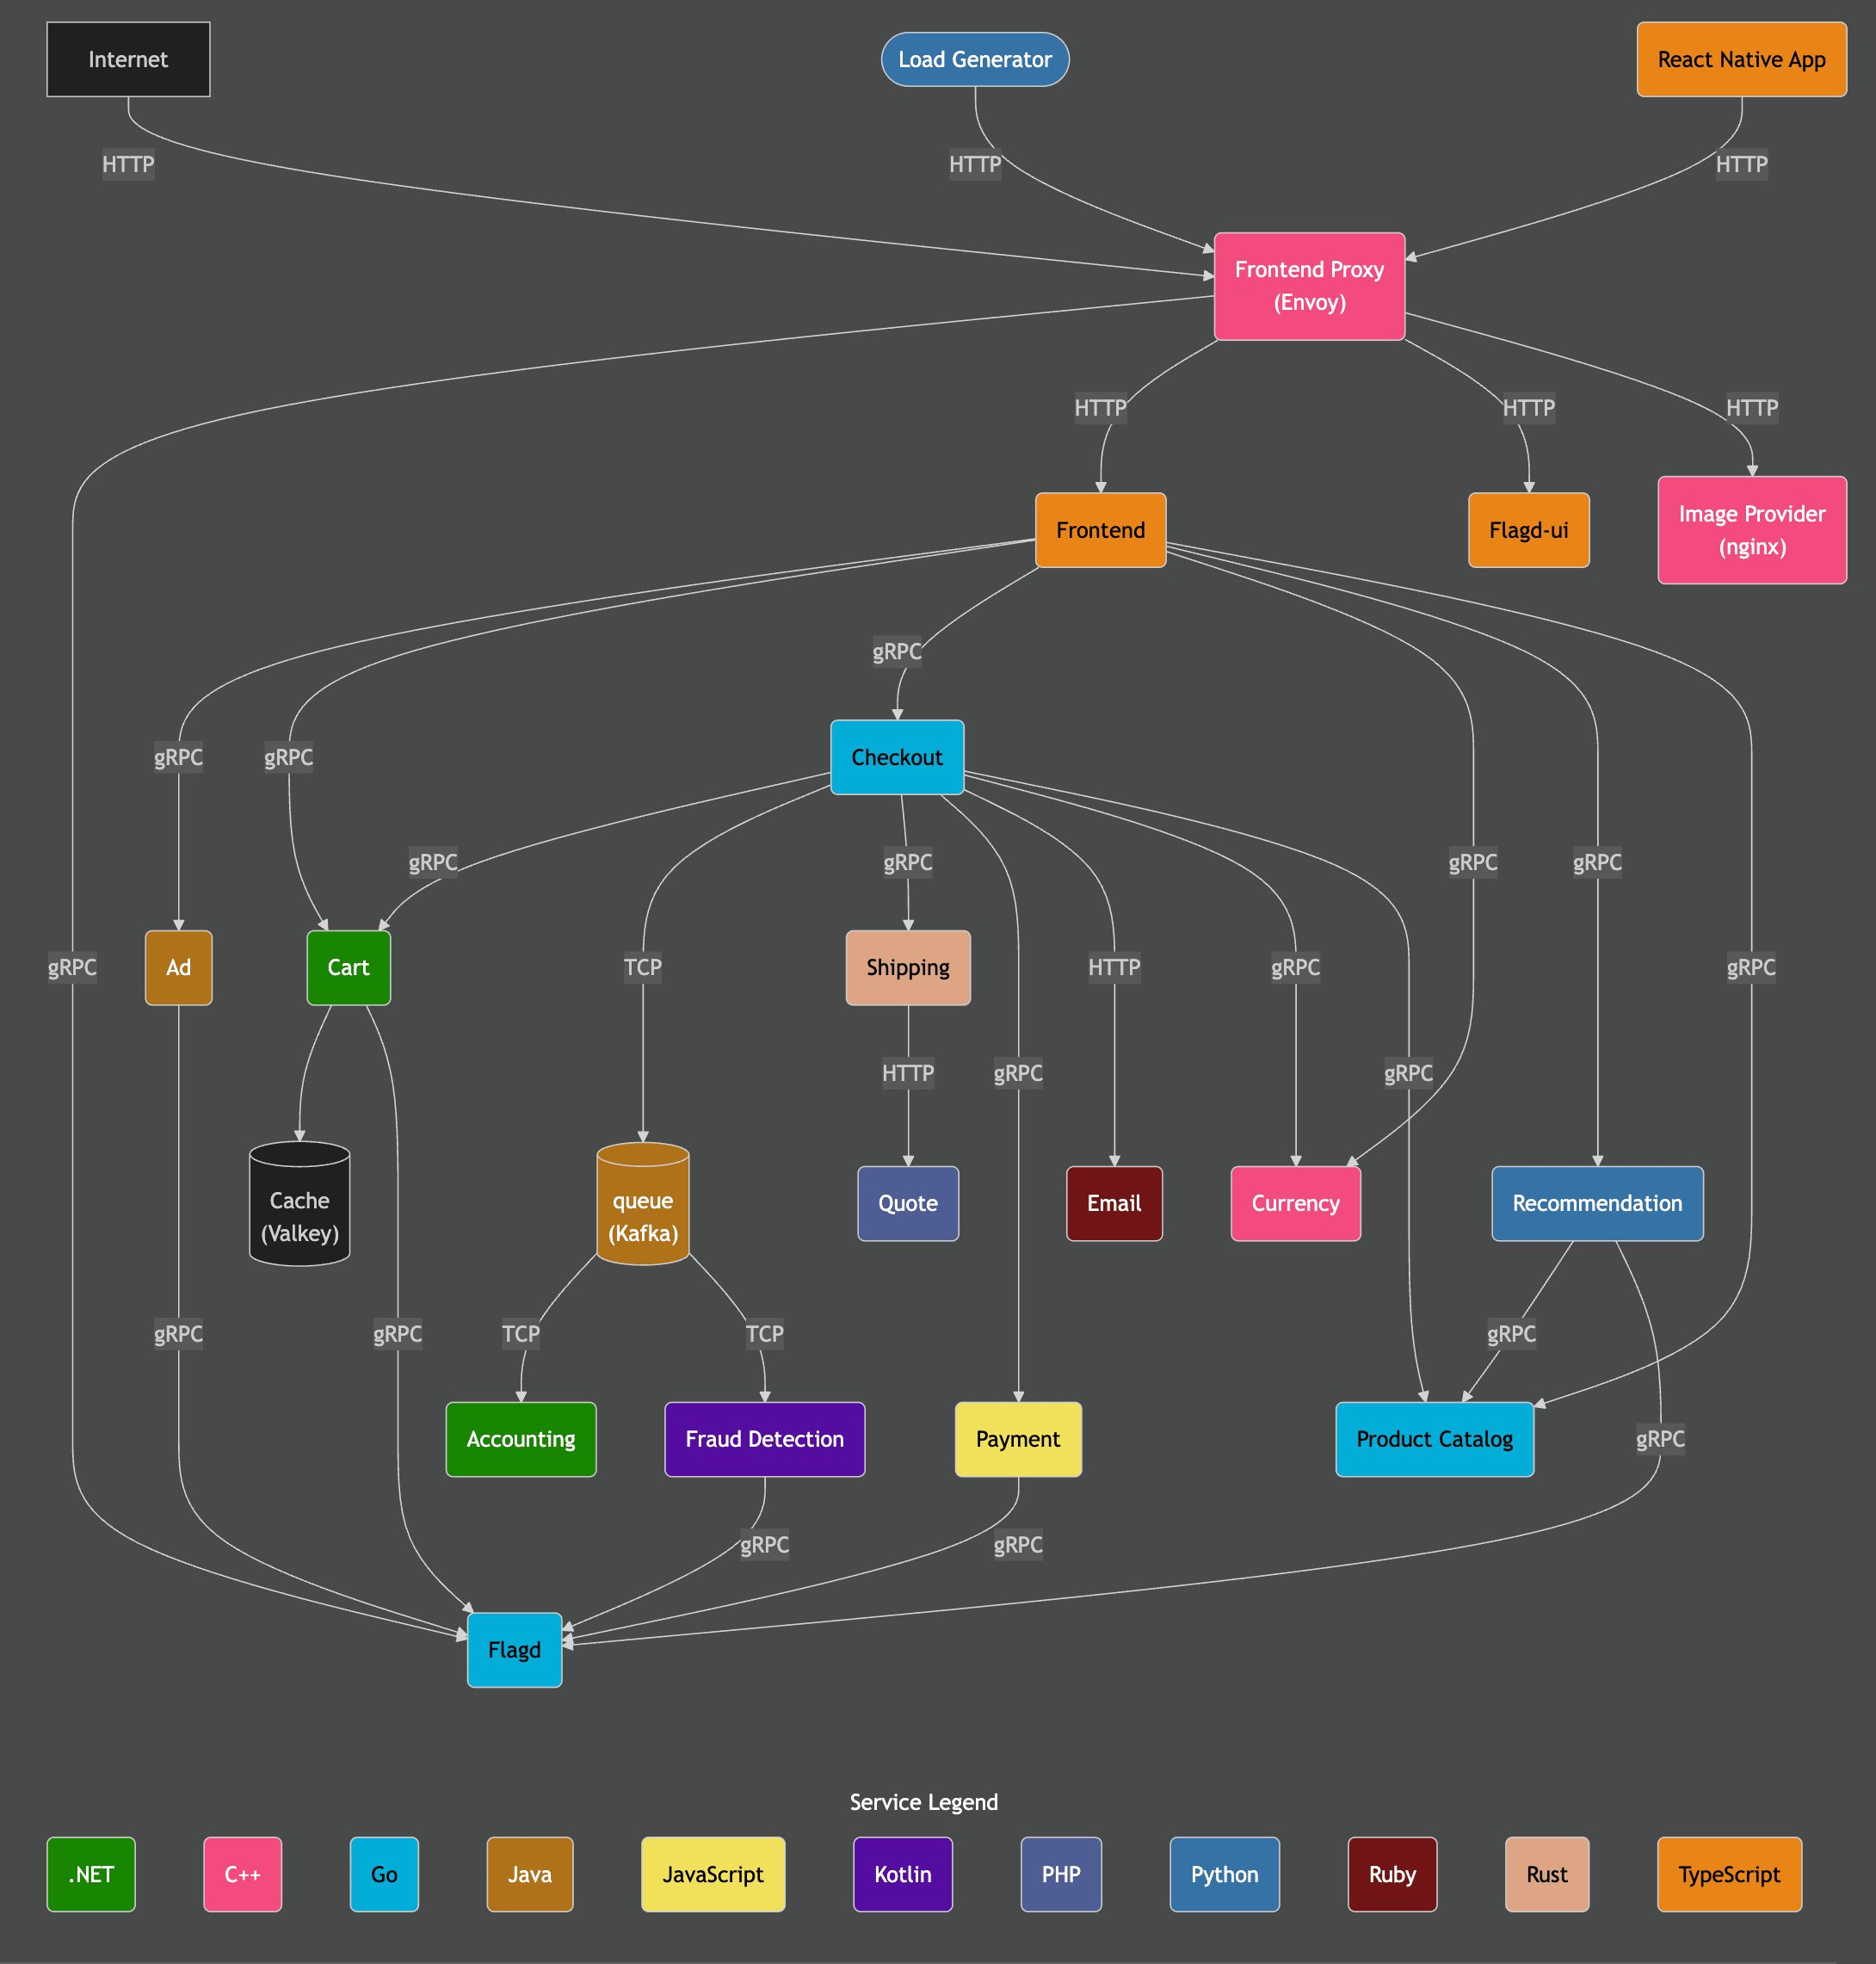
Deploy the demo
Download and deploy the demo manifest:otel-demo namespace and includes supporting services.
The commands use a pinned demo revision. After deploying the application, follow your deployment tab below to install the collectors and connect the demo telemetry. The collectors gather Kubernetes logs and infrastructure metrics, while the instrumented demo services send application telemetry through OTLP.
Configure collection
- Fully managed
- Self-managed
Deploy OpenTelemetry Collectors in your Kubernetes cluster to collect logs and metrics and forward them to your managed telemetry endpoint. ClickHouse Observability manages data ingestion, storage, and the UI, so you do not need to deploy ClickHouse, ClickStack UI, or MongoDB in your cluster.
1
Copy your connection details
Open your ClickHouse Observability service and go to Team Settings → Data → Managed Telemetry. Under OpenTelemetry Collector, select the URL tab and copy the OTLP HTTP endpoint and API key. Select Reveal key to view the full values.Use these connection details to configure the Kubernetes collectors in the following steps.
2
Store your connection details
Store the managed telemetry API key in a Kubernetes Secret and the OTLP HTTP endpoint in a ConfigMap. Create both in the namespace where you will install the collectors. The examples below use a dedicated If the namespace already exists, skip the first command. Replace the placeholders with the values from Managed Telemetry, keeping the endpoint’s HTTPS scheme and port.
otel-collectors namespace.3
Add the OpenTelemetry Helm repo
Use the official OpenTelemetry Helm chart to deploy collectors that send logs and metrics to your managed telemetry endpoint.Add the chart repository and refresh its index:
4
Deploy Kubernetes collector components
To collect logs and metrics from both the cluster itself and each node, we’ll need to deploy two separate OpenTelemetry collectors, each with its own Helm values file. The two files provided -
Next, deploy the collector as a DaemonSet for node and pod-level metrics and logs:
The DaemonSet example sets Look for authentication, export, or scrape errors in the logs. A running pod alone does not confirm that telemetry has been delivered.
k8s_deployment.yaml and k8s_daemonset.yaml - work together to collect comprehensive telemetry data from your Kubernetes cluster.-
k8s_deployment.yamldeploys a single OpenTelemetry Collector instance responsible for collecting cluster-wide events and metadata. It gathers Kubernetes events, cluster metrics, and enriches telemetry data with pod labels and annotations. This collector runs as a standalone deployment with a single replica to avoid duplicate data. -
k8s_daemonset.yamldeploys a DaemonSet-based collector that runs on every node in your cluster. It collects node-level and pod-level metrics, as well as container logs, using components likekubeletstats,hostmetrics, and Kubernetes attribute processors. These collectors enrich logs with metadata and send them to your managed telemetry endpoint using the OTLP HTTP exporter.
0.175.0 with Collector 0.161.0.First, install the collector as a Deployment:k8s_deployment.yaml
k8s_deployment.yaml
k8s_daemonset.yaml
k8s_daemonset.yaml
insecure_skip_verify: true for the local kubelet connection because local clusters can use certificates that do not cover the node address. For production, configure a trusted kubelet certificate and enable certificate verification. This setting does not affect TLS verification for the managed telemetry endpoint.Check that the collectors are ready:5
Connect the demo application
If you deployed the demo, point its exporters at the in-cluster collector. The collector adds the managed endpoint’s authentication header when forwarding telemetry.The managed API key belongs in the
otel-collectors namespace, as configured above. The demo sends to the in-cluster receiver, so it does not need that key.Explore Kubernetes data
Open your ClickHouse Observability service. In Search, select the Logs source and a time range that includes when the collectors were running. Look for a log message from one of your workloads and inspect its Kubernetes resource attributes, such ask8s.namespace.name and k8s.pod.name.
The example below shows logs from a local Kubernetes cluster, including a sample-logs workload emitting Kubernetes documentation test messages. Your service names and log messages will depend on your workloads.
In Chart Explorer, select Time Series and the Metrics source. Choose Average of k8s.pod.memory.usage, group by ResourceAttributes['k8s.pod.name'], and leave Delta unchecked. Select a time range that includes when the collectors were running, then select Run to compare memory usage across pods. If the chart has gaps, choose a time granularity at least as large as the collection interval.
To explore the prebuilt Kubernetes dashboard, open Dashboards in the sidebar and select Kubernetes under Preset Dashboards. Select the Logs and Metrics sources and a time range that includes when the collectors were running.
Use the Pods, Nodes, and Namespaces tabs to explore your cluster. You can narrow the view using the pod, deployment, node, namespace, and cluster filters.