

Before you begin
You need a fully managed ClickHouse Observability service and access to its telemetry endpoint and API key.Create a service
If you don’t have a service yet, start with Create a ClickHouse service in the ClickHouse Cloud quickstart. Once your service is running, open ClickHouse Observability. If the service has no data yet, the Getting Started page opens automatically. Choose one of the three paths below to send telemetry.Set up ClickHouse Observability
Choose the path that matches your environment.- Use an existing OpenTelemetry setup
- Instrument with AI
- Follow setup guides
Use this path if your application, agent, or collector already produces OpenTelemetry data.
- Select View connection details on the getting started page.
- Copy the configuration for your telemetry sender. The connection details provide URL, Collector config, and Env vars options.
- Configure your sender to export telemetry to the managed endpoint using the provided authentication details.
- Generate normal activity in your application, then confirm that the resulting data appears in Search.
Verify ingestion and start exploring
After completing your chosen path, select Start exploring to open Search. Look for an event you generated and confirm that it is present before continuing. For logs, select the Logs source and a time range that includes when you sent the event. The example below shows a log sent using the UI’s send a test log button, withexample-service as its service name. Expand an event to inspect its attributes.
Next steps
Send application and infrastructure data
Choose a guide for the data that you want to send to ClickHouse Observability:Ingesting data overview
Explore ingestion options and guides for applications, collectors, and integrations.
Instrument an application
Instrument the HackerNews Analyzer app and explore logs, traces, metrics, and session replay.
Monitor Kubernetes
Collect cluster logs and metrics and explore the Kubernetes dashboard.
Explore sample data
Use a sample dataset to explore ClickHouse Observability with richer telemetry:Sample logs, traces, and metrics
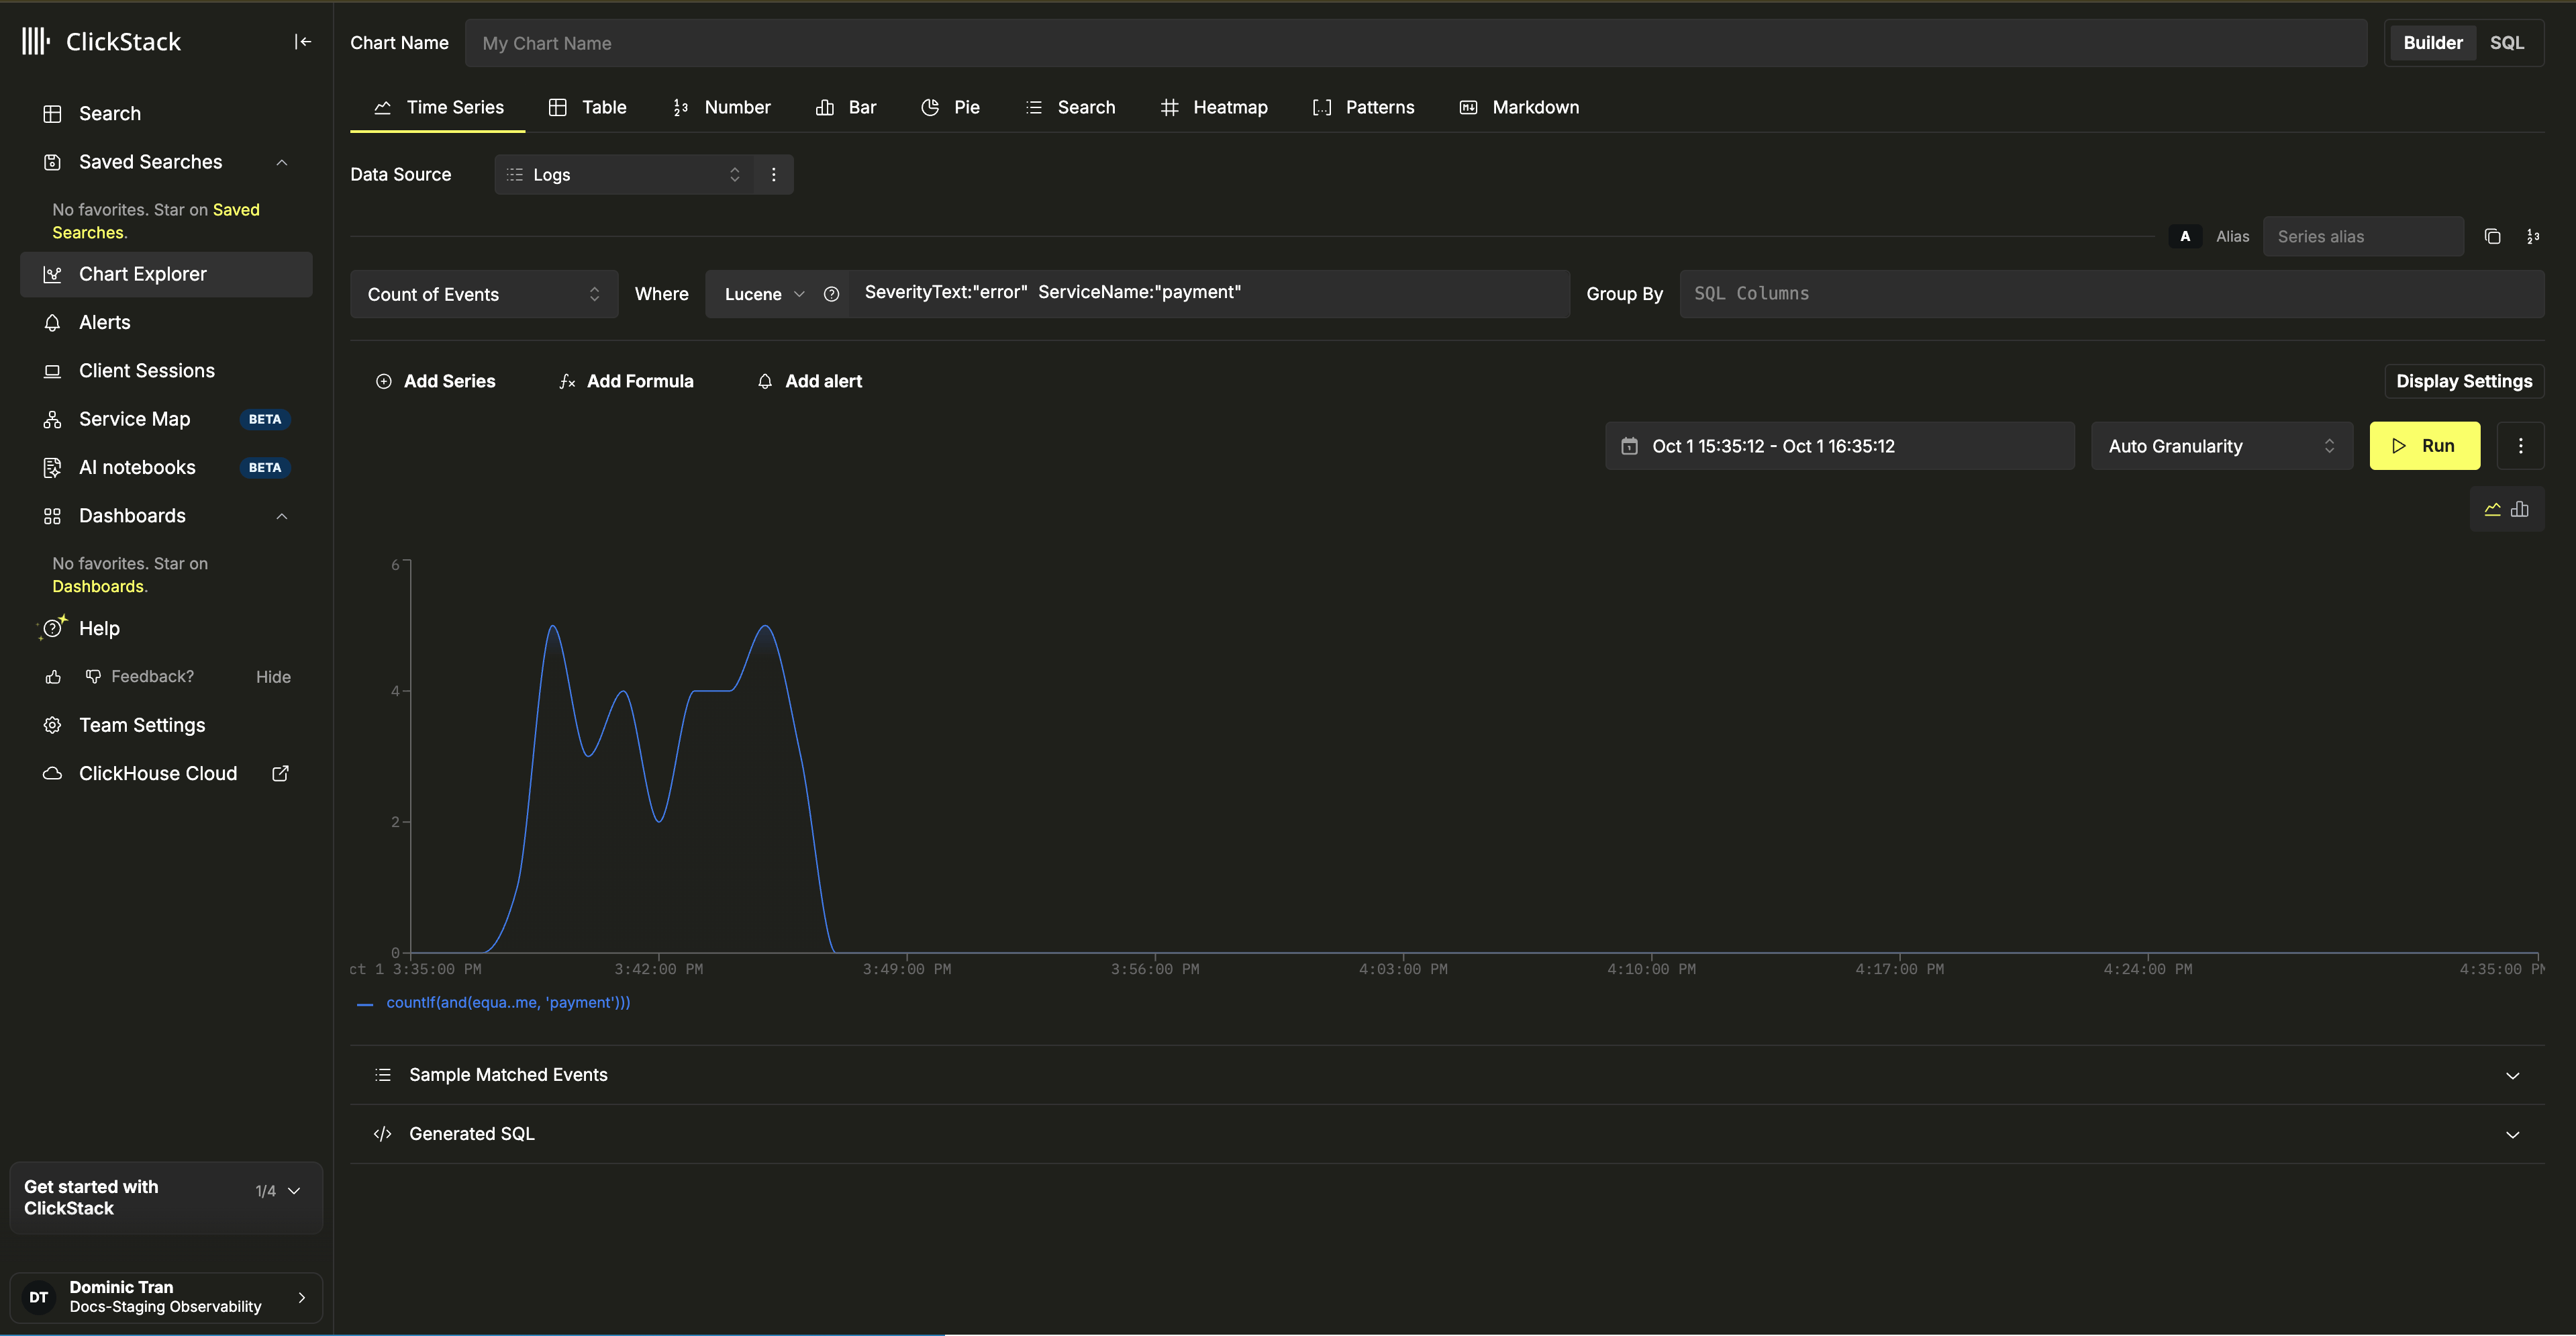
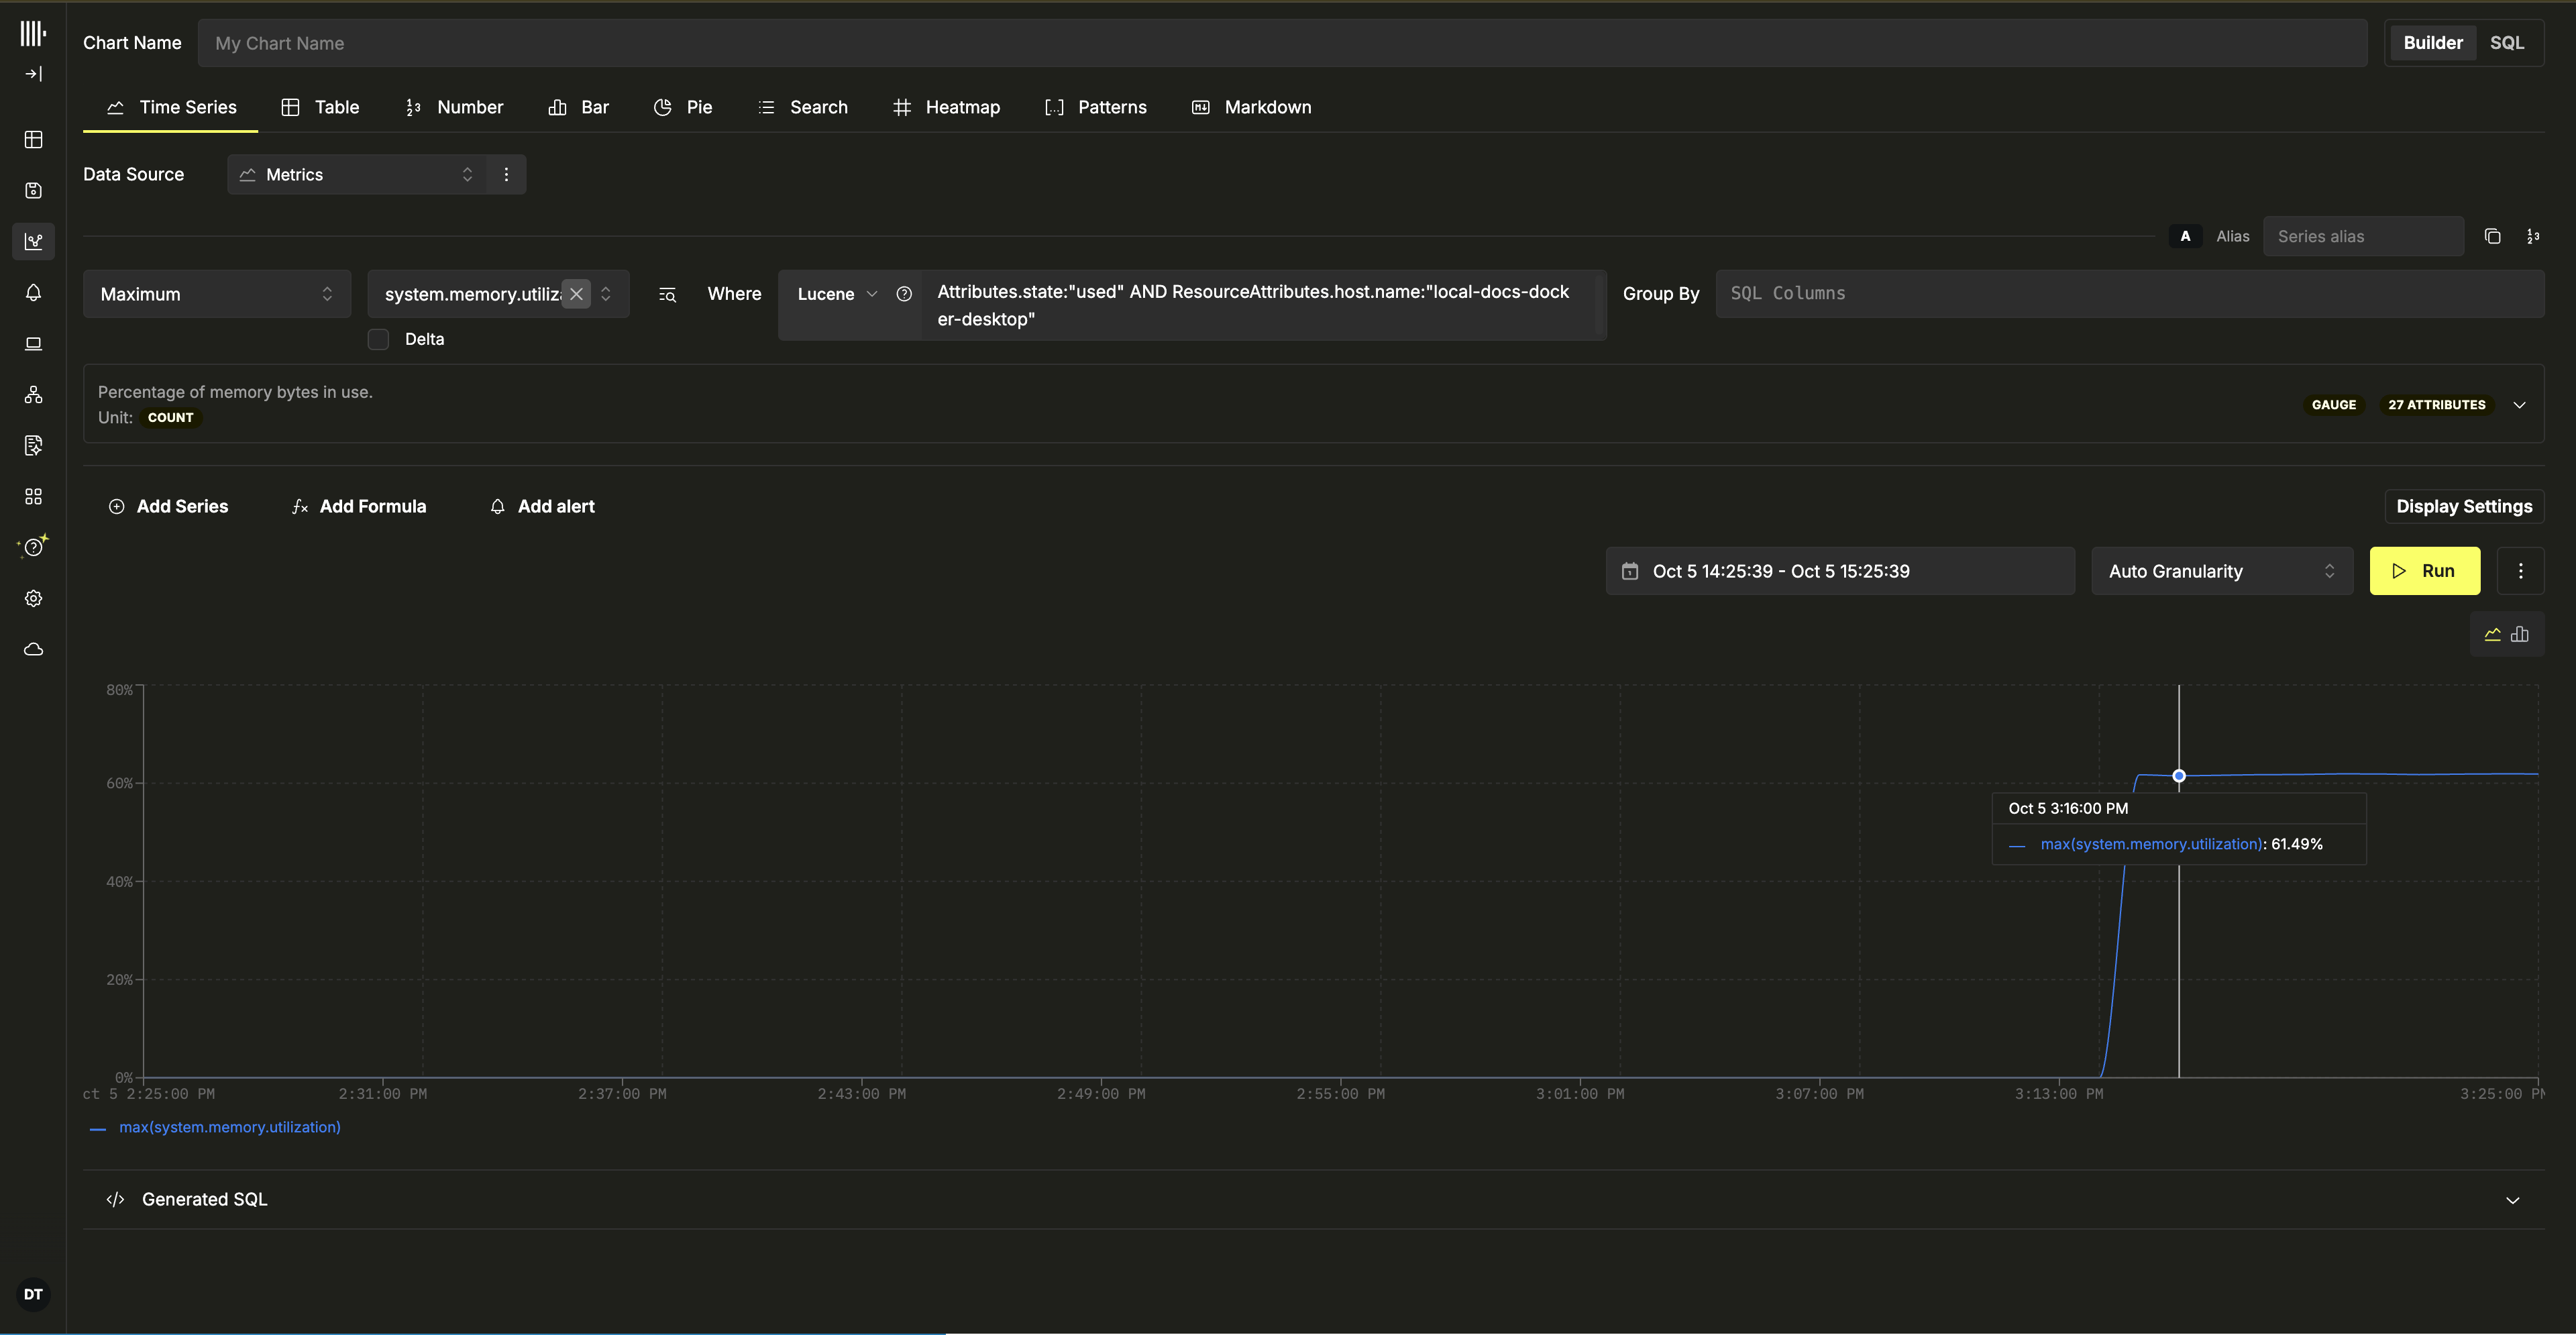
Local logs and metrics
Generate synthetic data
Use a generator to test ingestion without an existing application or dataset:Generate data with otelgen
Send synthetic OTLP logs, traces, and metrics to your managed telemetry endpoint.
Generate data with telemetrygen
Generate configurable OpenTelemetry signals to test your managed service.