- Fully managed
- Self-managed
TL;DRClone the HackerNews Analyzer, fill
.env with your managed OTLP HTTP endpoint and API key, then paste the agent prompt. The backend needs no OpenTelemetry imports; the agent wires @hyperdx/node-opentelemetry at process start.Time required: about 10 minutesPrerequisites
- Node.js and npm versions compatible with the HackerNews Analyzer and its dependencies.
- An existing fully managed ClickHouse Observability service. See the fully managed Getting Started guide.
- Network access to the managed telemetry endpoint from both the app server and your browser.
Clone the repository
Clone HackerNews Analyzer, install dependencies, and copy the env template:.env in the next steps, then instrument from this directory.Instrument the application
1
Run the application
From the cloned Open http://localhost:5001. You will see a year selector, summary statistics, an activity chart, top users and domains tables, and a search box. Click around: switch years, drill into stories.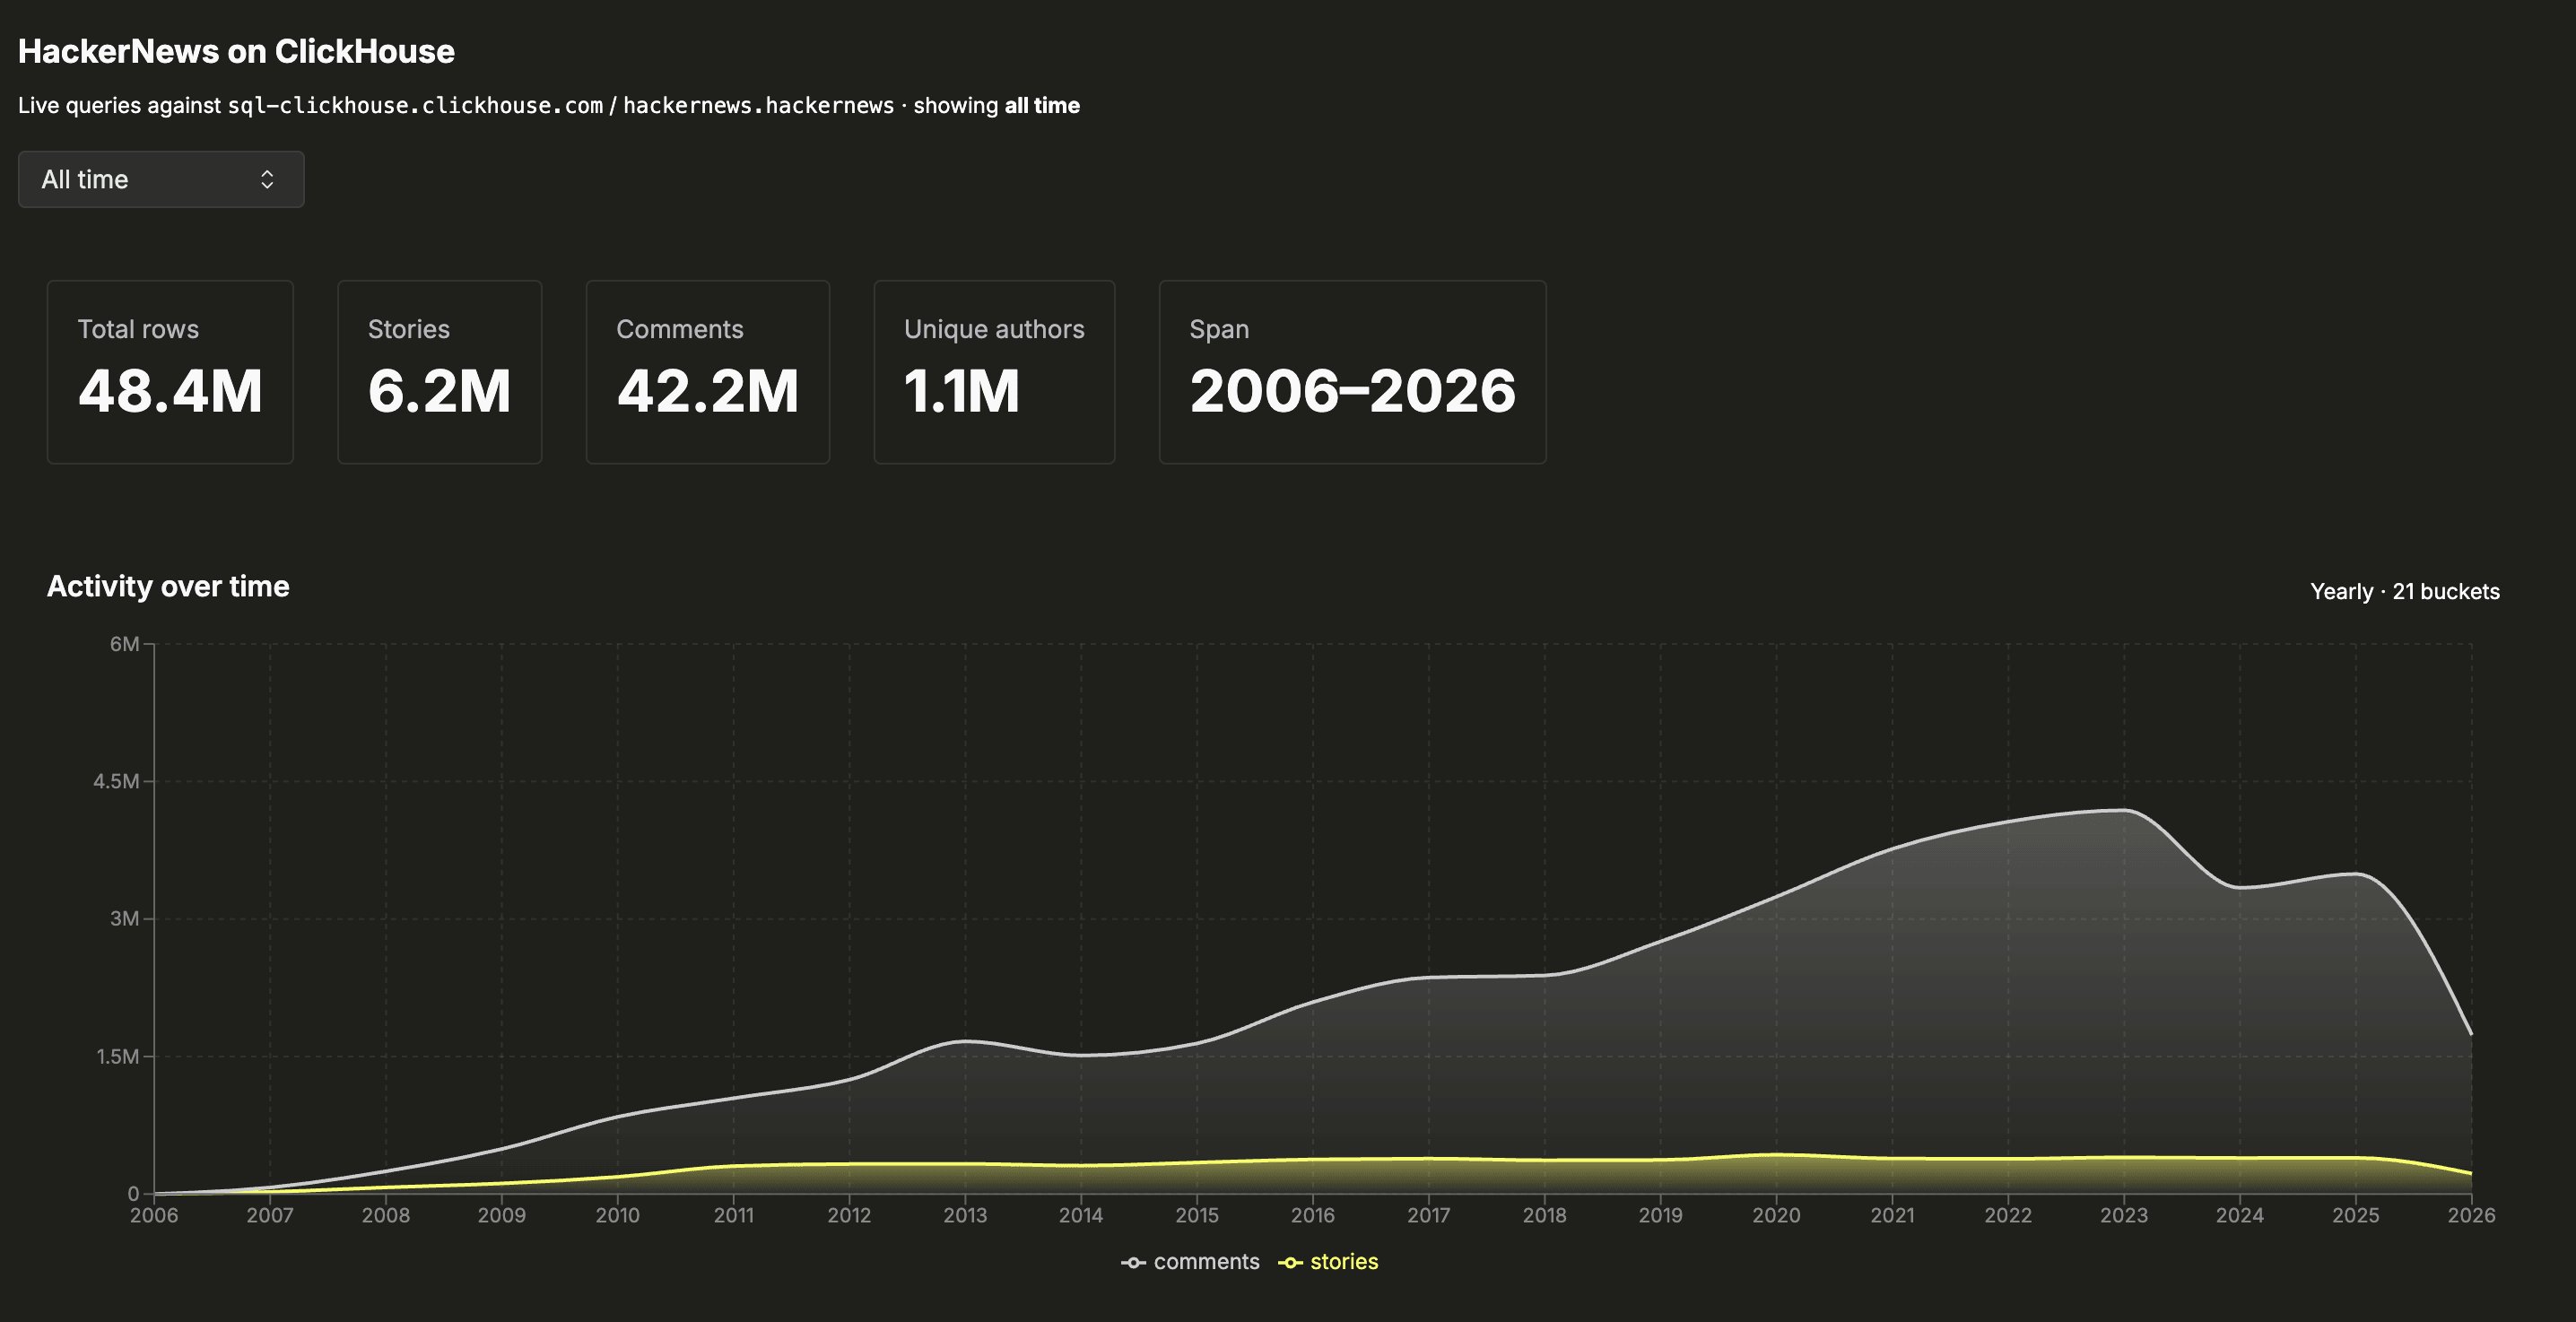
hn-news-analyzer directory, start the app. The ClickHouse data source defaults to the public read-only demo cluster, so it runs without any further configuration:2
Configure environment
Open your ClickHouse Observability service and go to Team Settings → Managed Telemetry. Copy the OTLP HTTP endpoint and API key.In the app’s Keep the
.env file, set the following values, replacing the endpoint and API key placeholders:https:// prefix in OTEL_EXPORTER_OTLP_ENDPOINT and do not append /v1/logs, /v1/traces, or /v1/metrics. The SDKs append the signal paths. Set OTEL_EXPORTER_OTLP_HEADERS to authorization=<your-api-key> without a Bearer prefix; the app also passes this key directly to the browser SDK.The browser SDK uses the same endpoint and API key. vite.config.ts embeds them in the browser bundle, where visitors can inspect them. Use a service intended for testing this demo and keep .env out of version control.3
Instrument the application
Pick one path. All three end at the same instrumented app.
- Agent instrumentation
- Manual instrumentation
- Use a pre-instrumented branch
With the repo cloned and
.env filled in, paste this prompt into a coding agent in that directory to instrument the application.4
Generate traffic and view telemetry
Restart the application so the new launch command and freshly built browser bundle take effect:Confirm the startup banner prints three 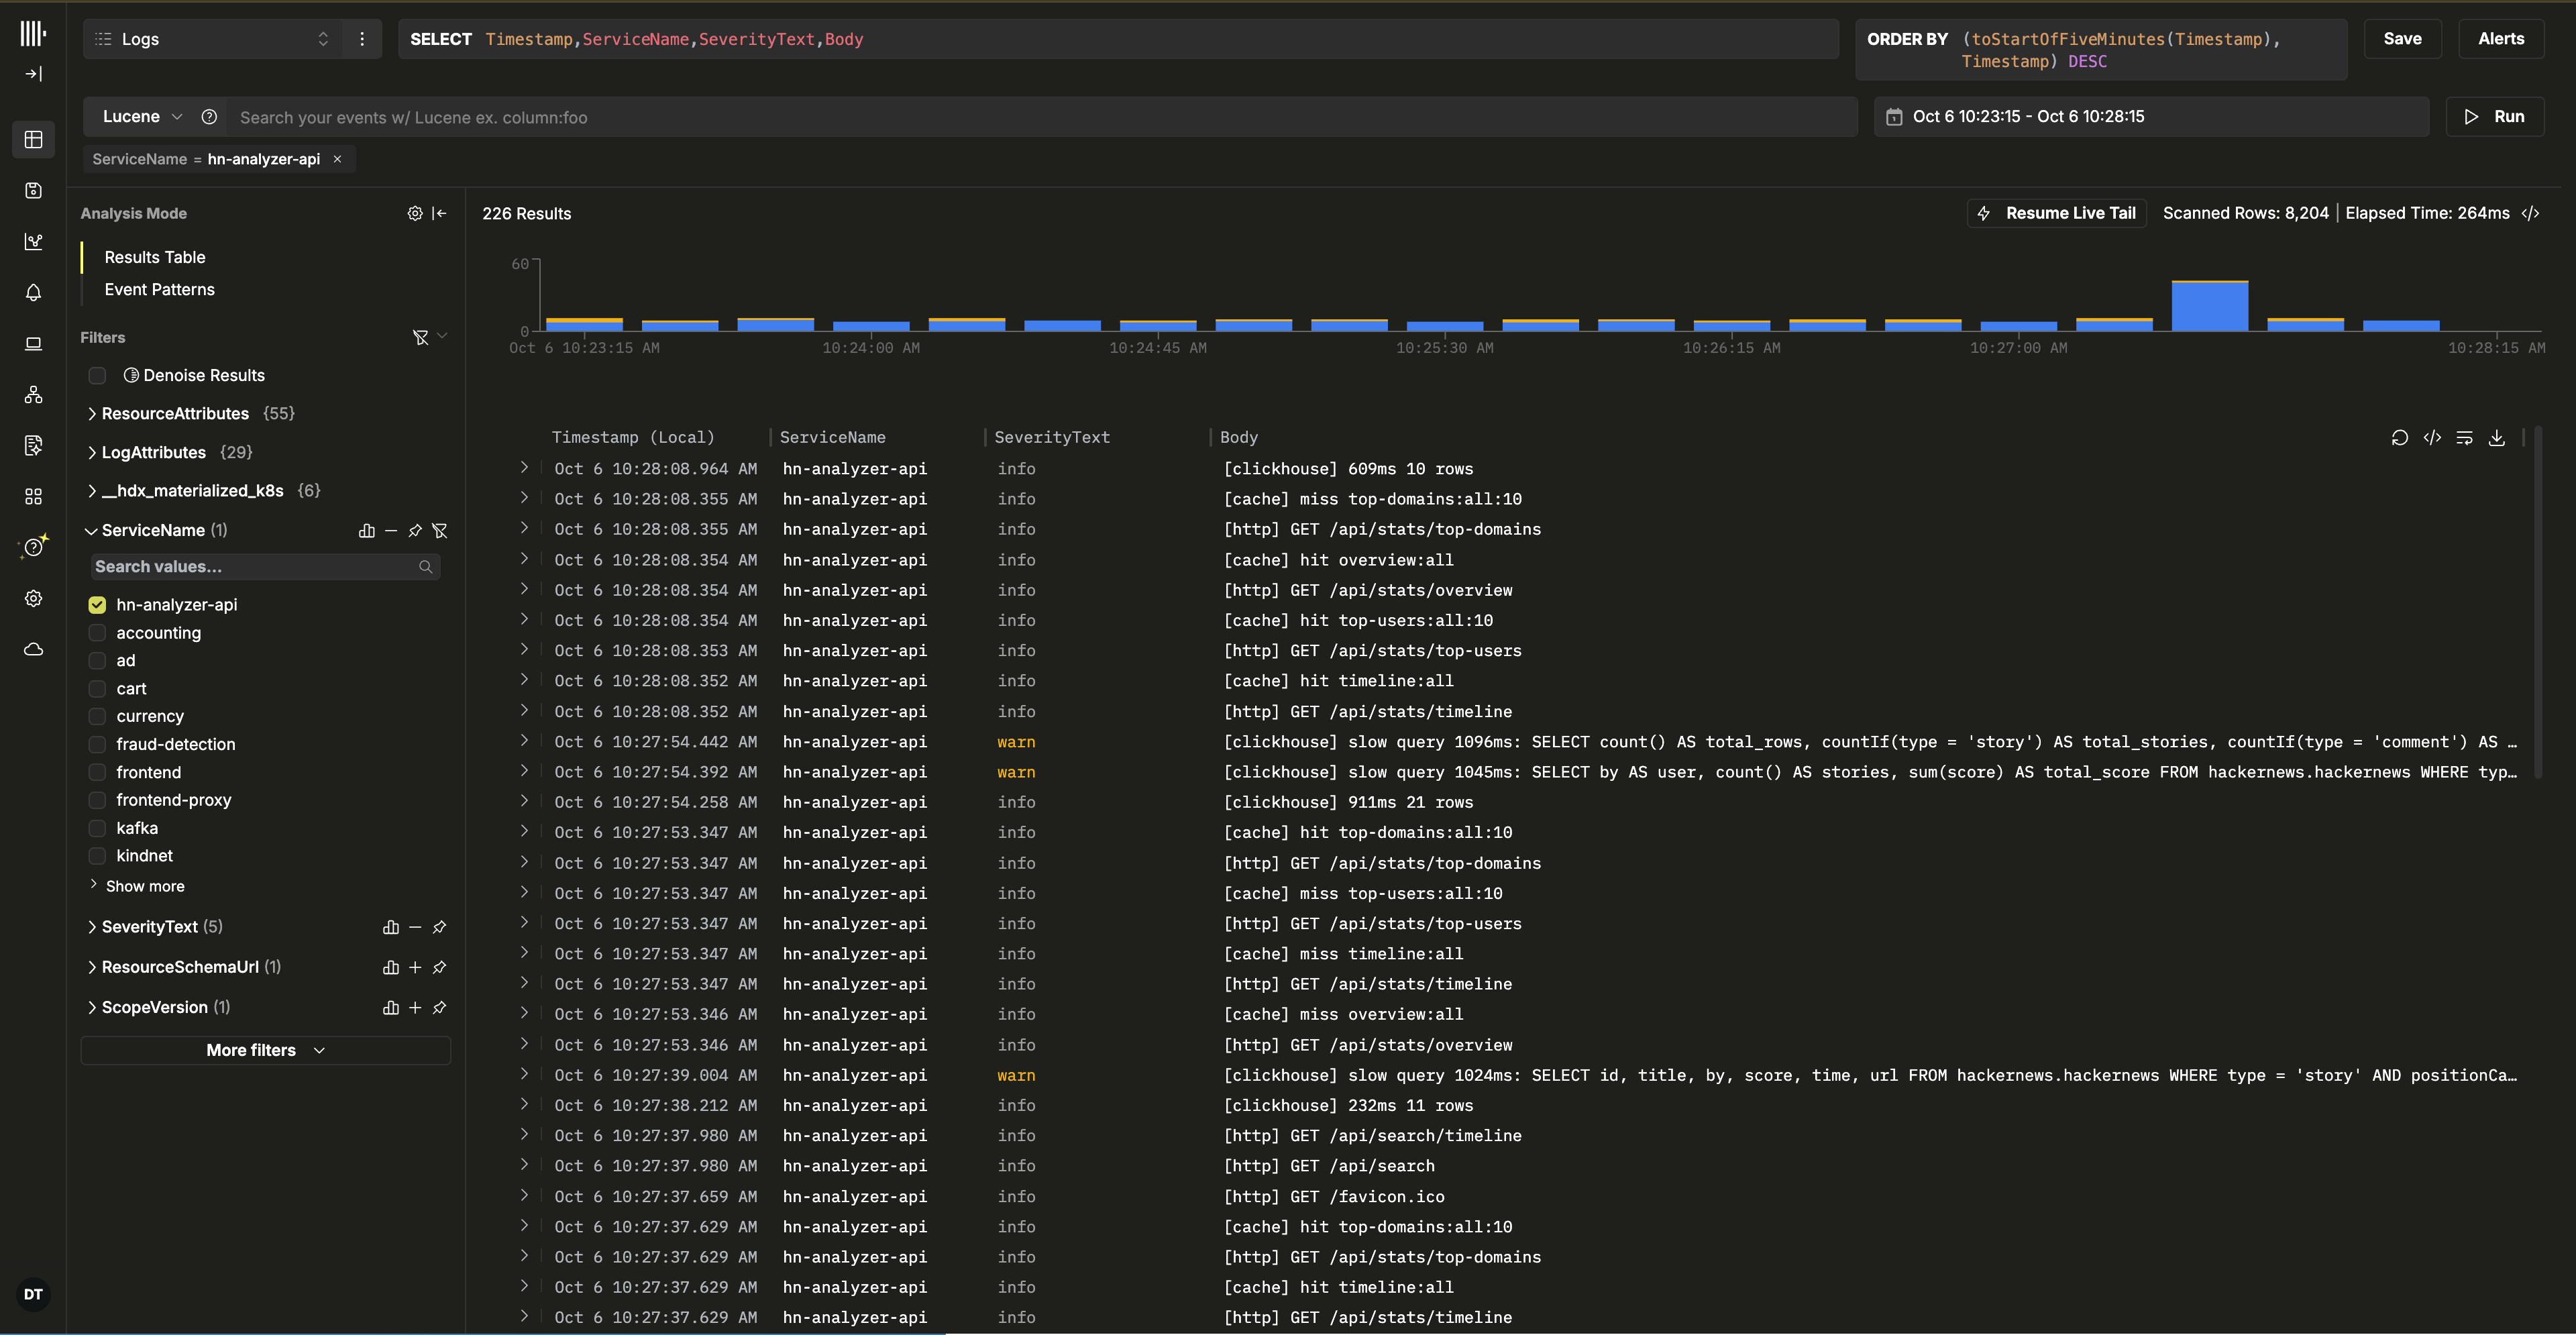
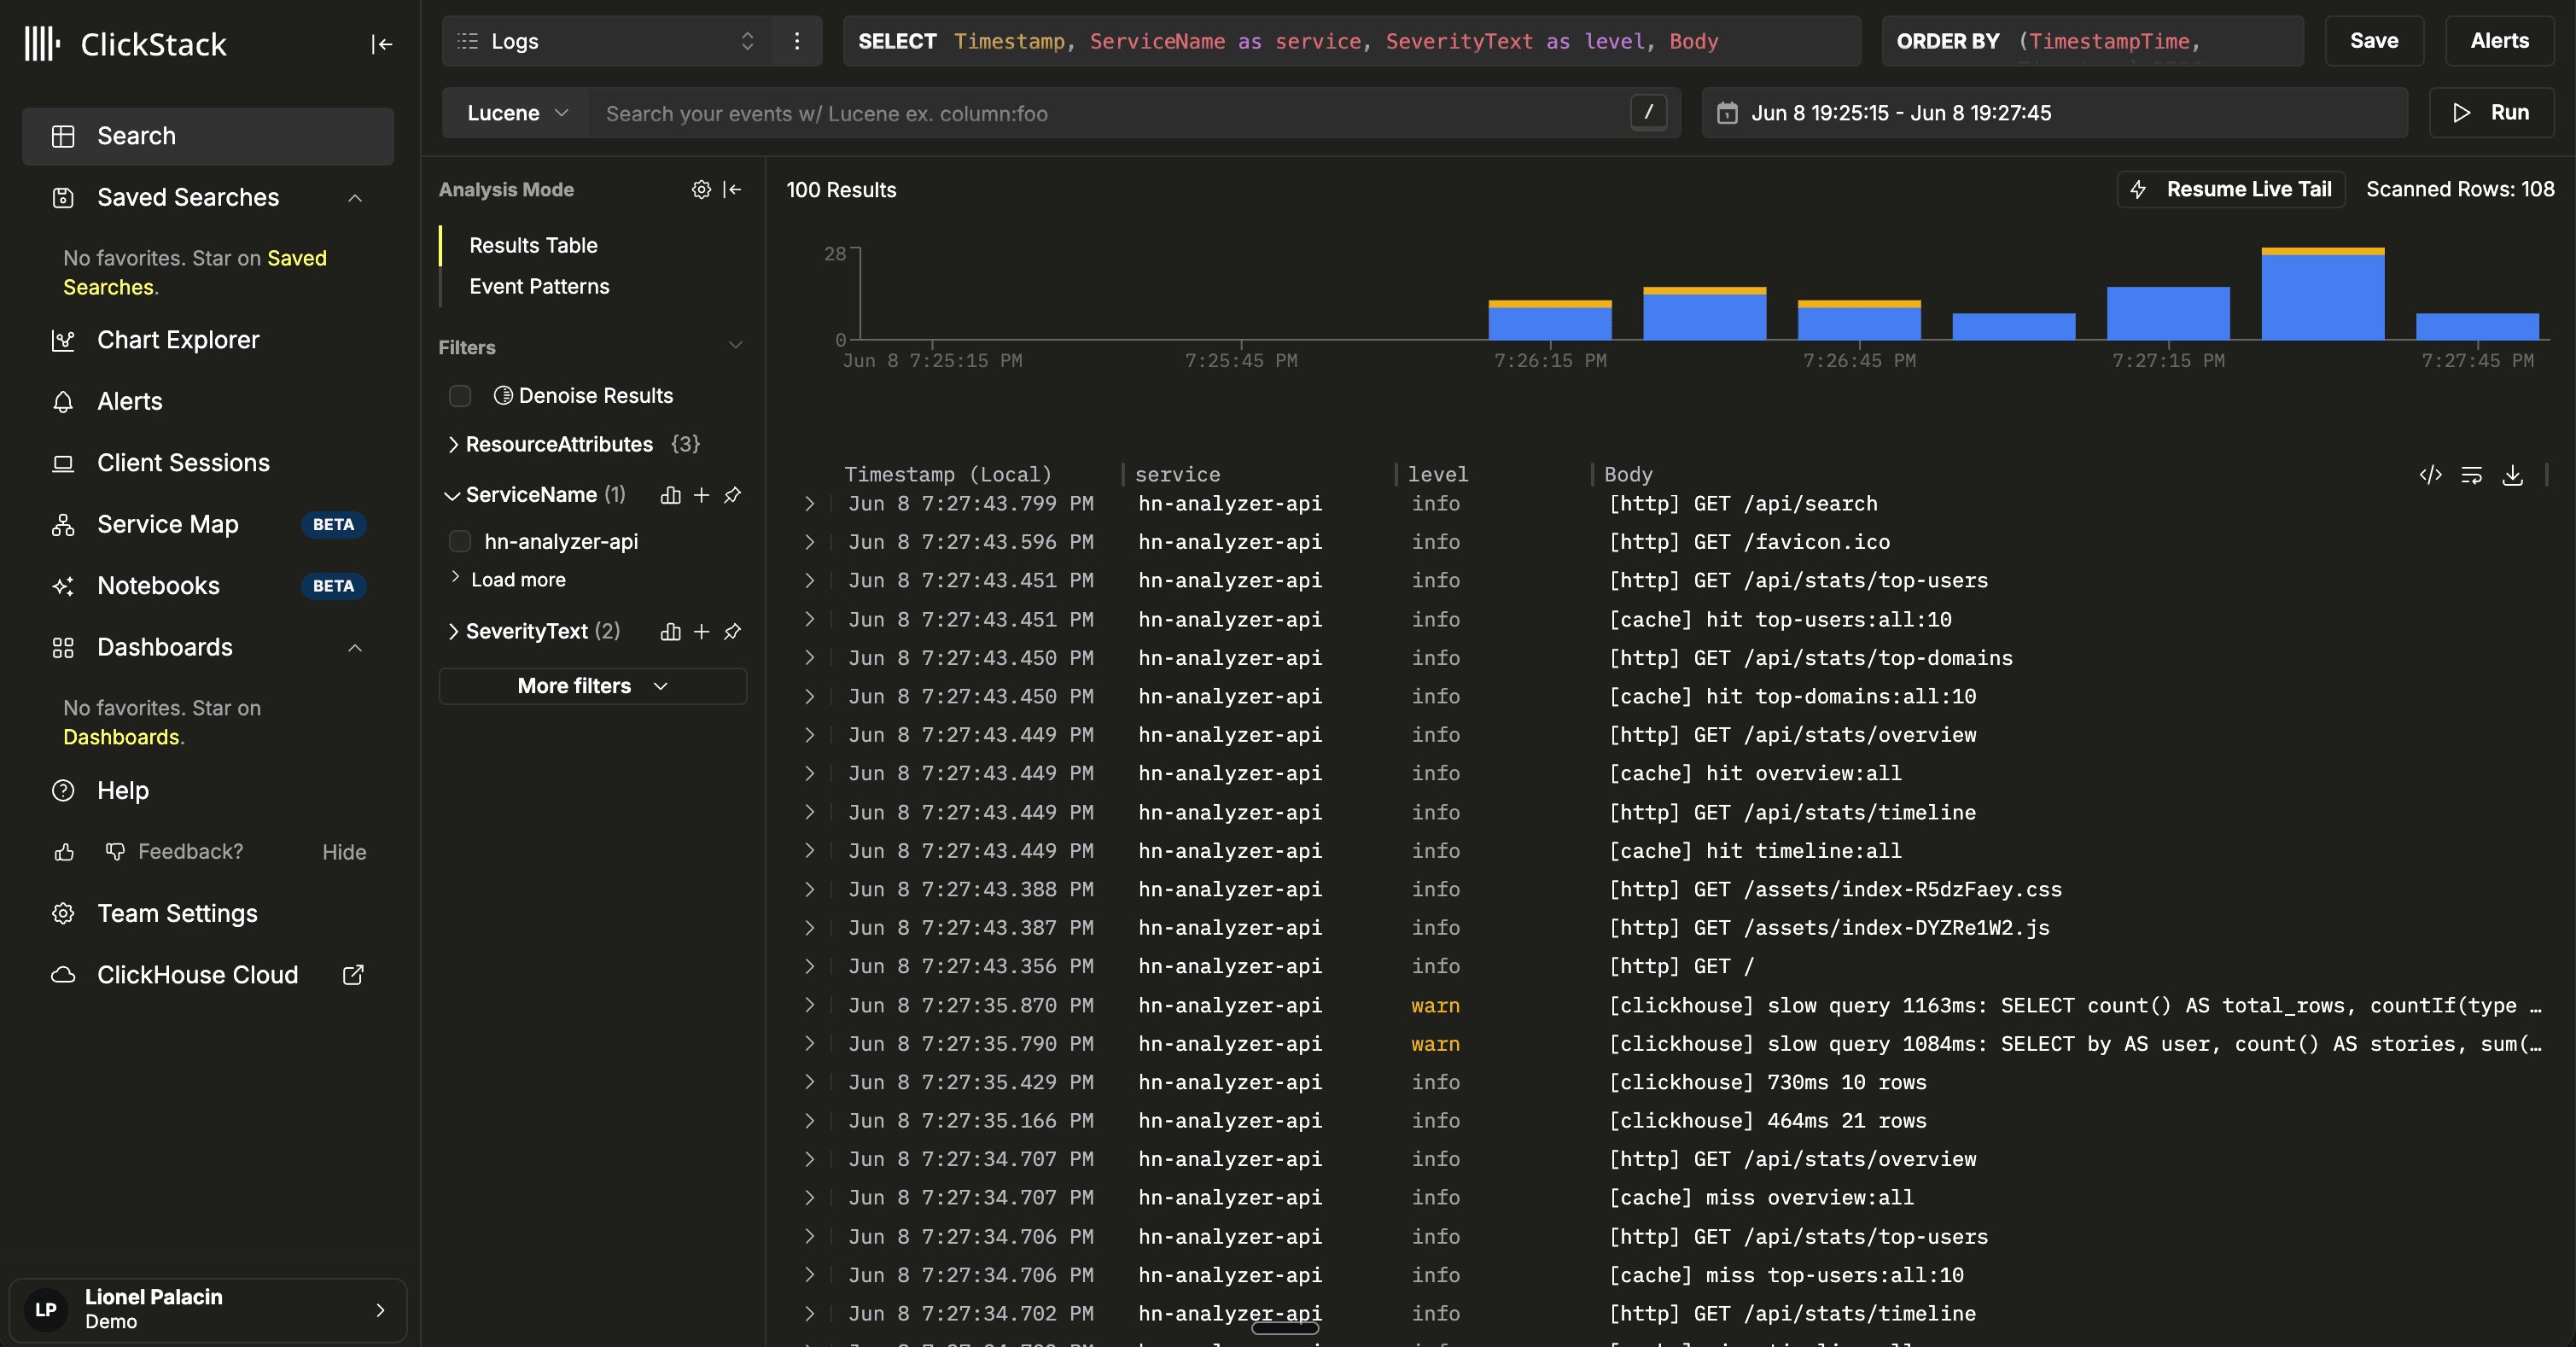
Health check passed lines for /v1/traces, /v1/metrics, and /v1/logs. Reload the browser tab so Vite serves the updated bundle, then switch years and click into stories to generate traffic.Open your ClickHouse Observability service:- Go to Search, select the Logs source, and set the time range to Last 15 minutes. Filter
ServiceNametohn-analyzer-apito find the backend logs.
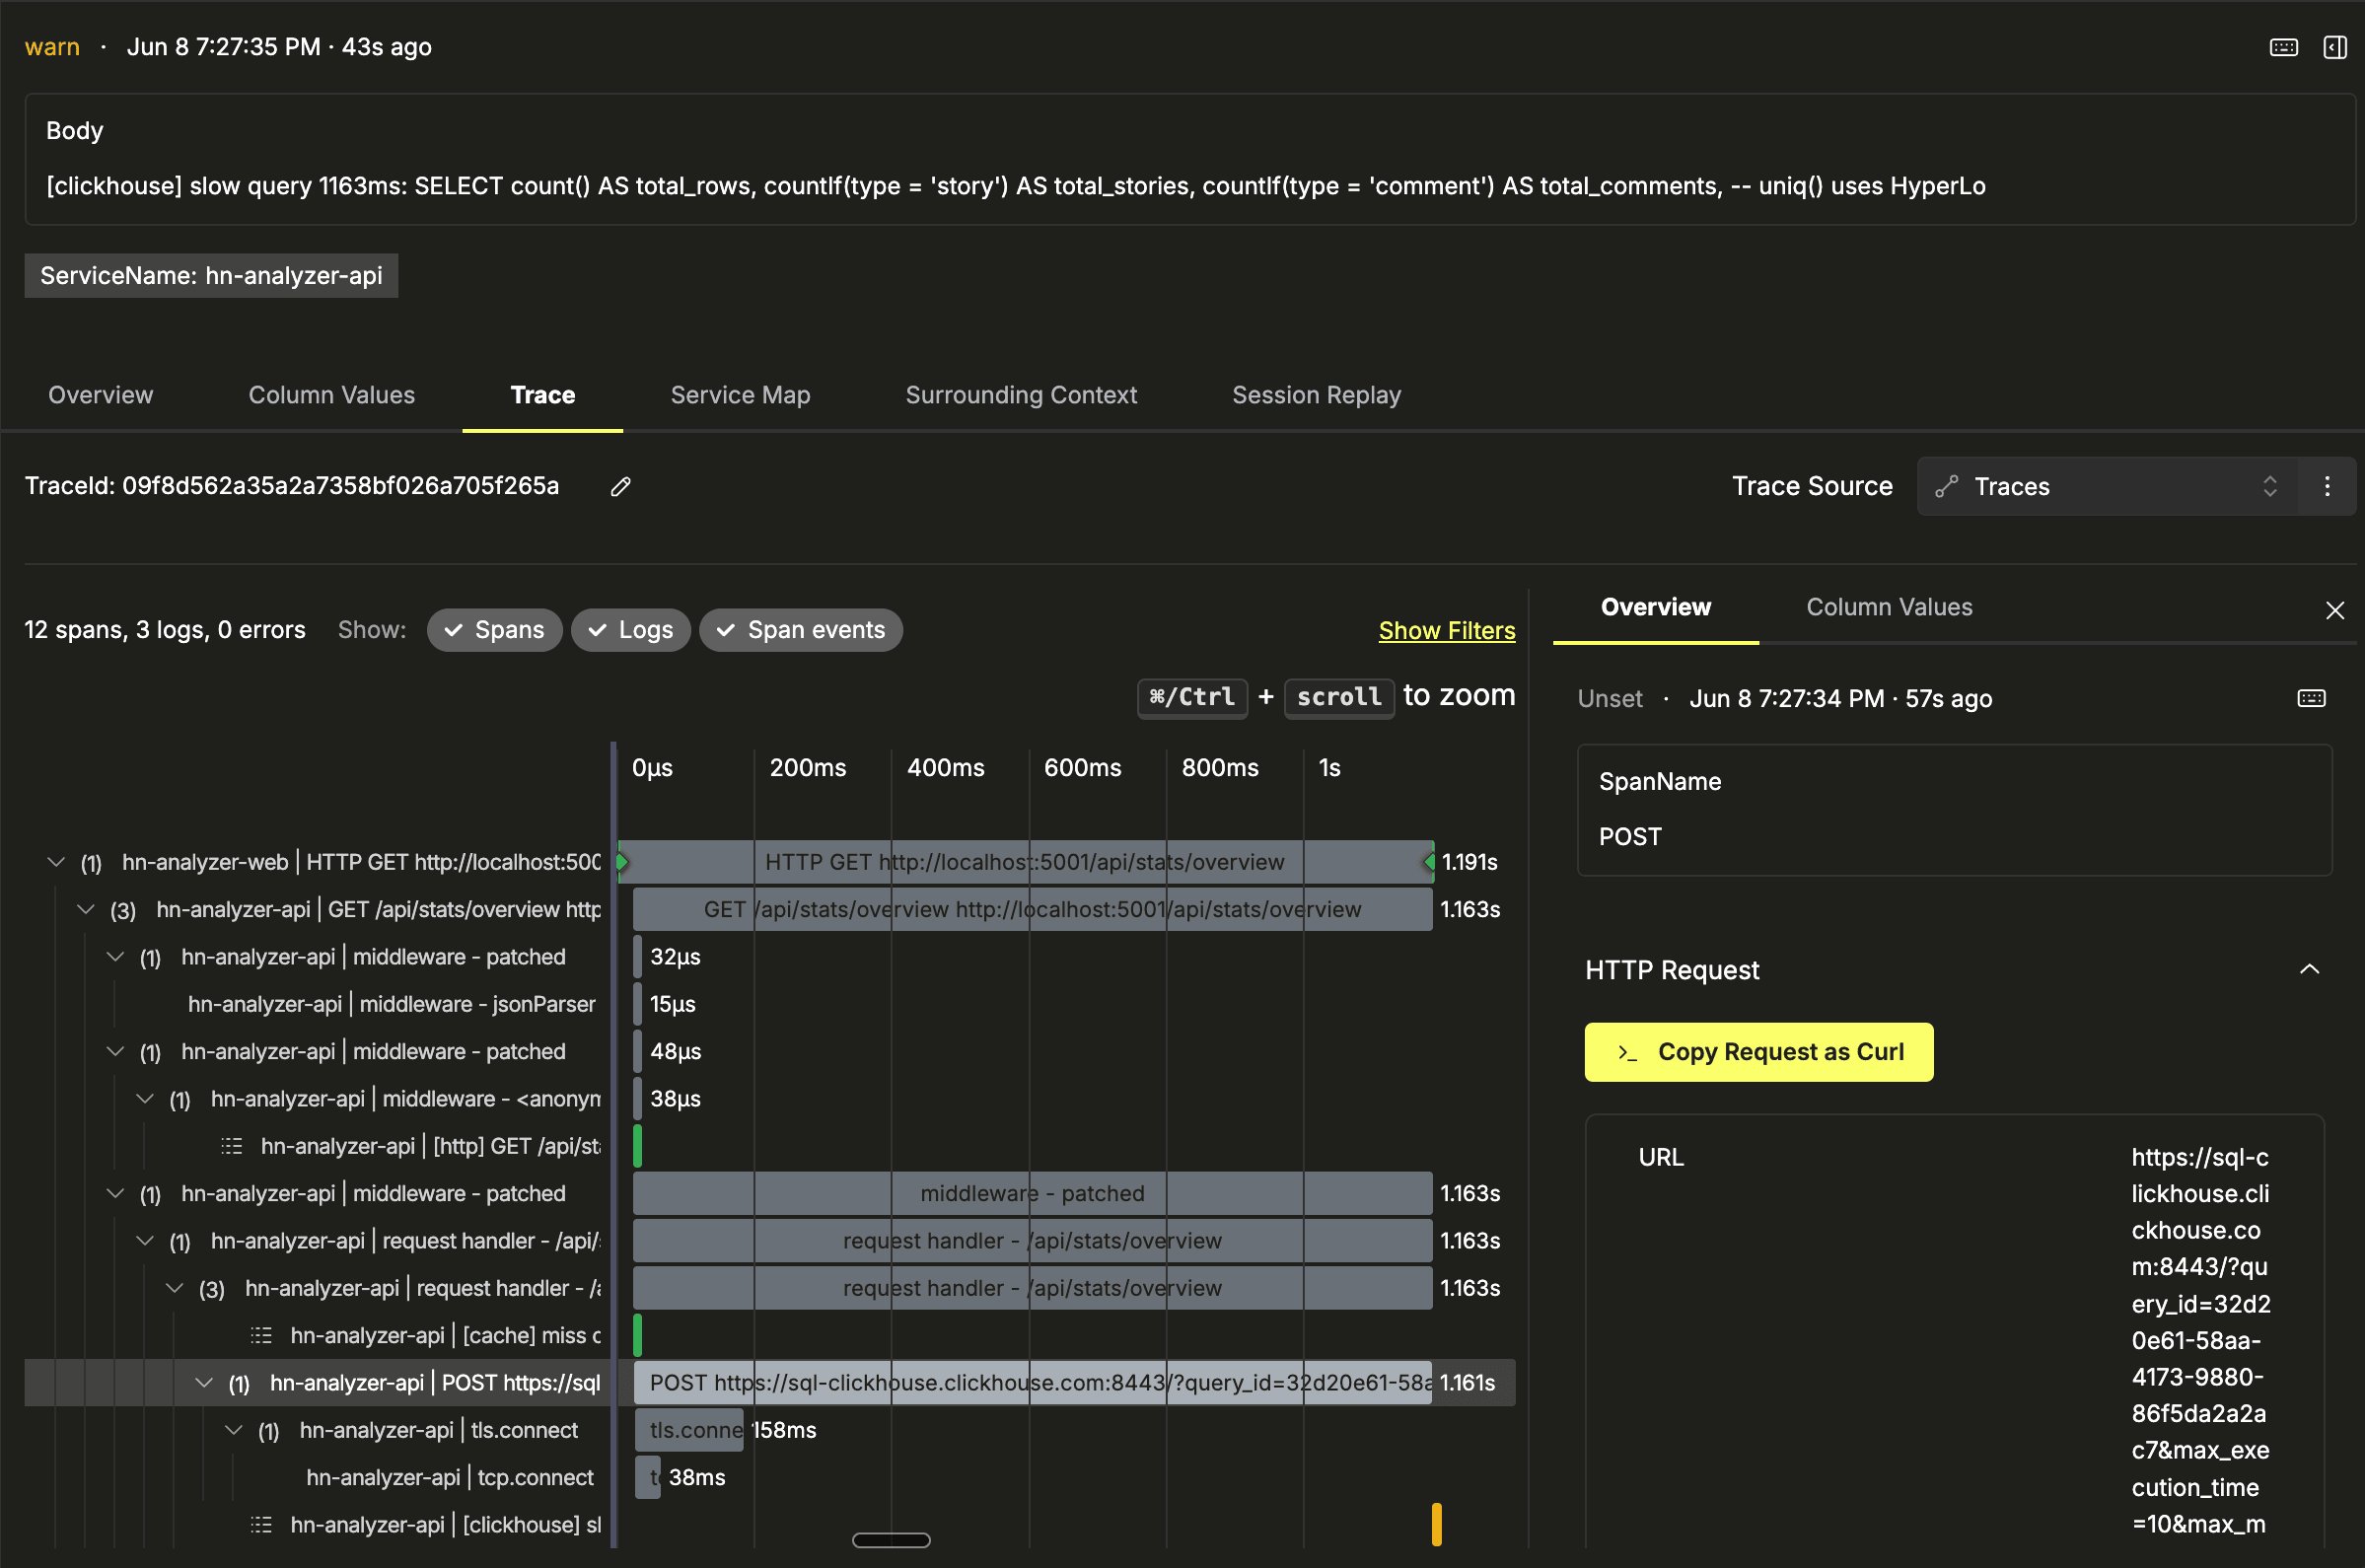
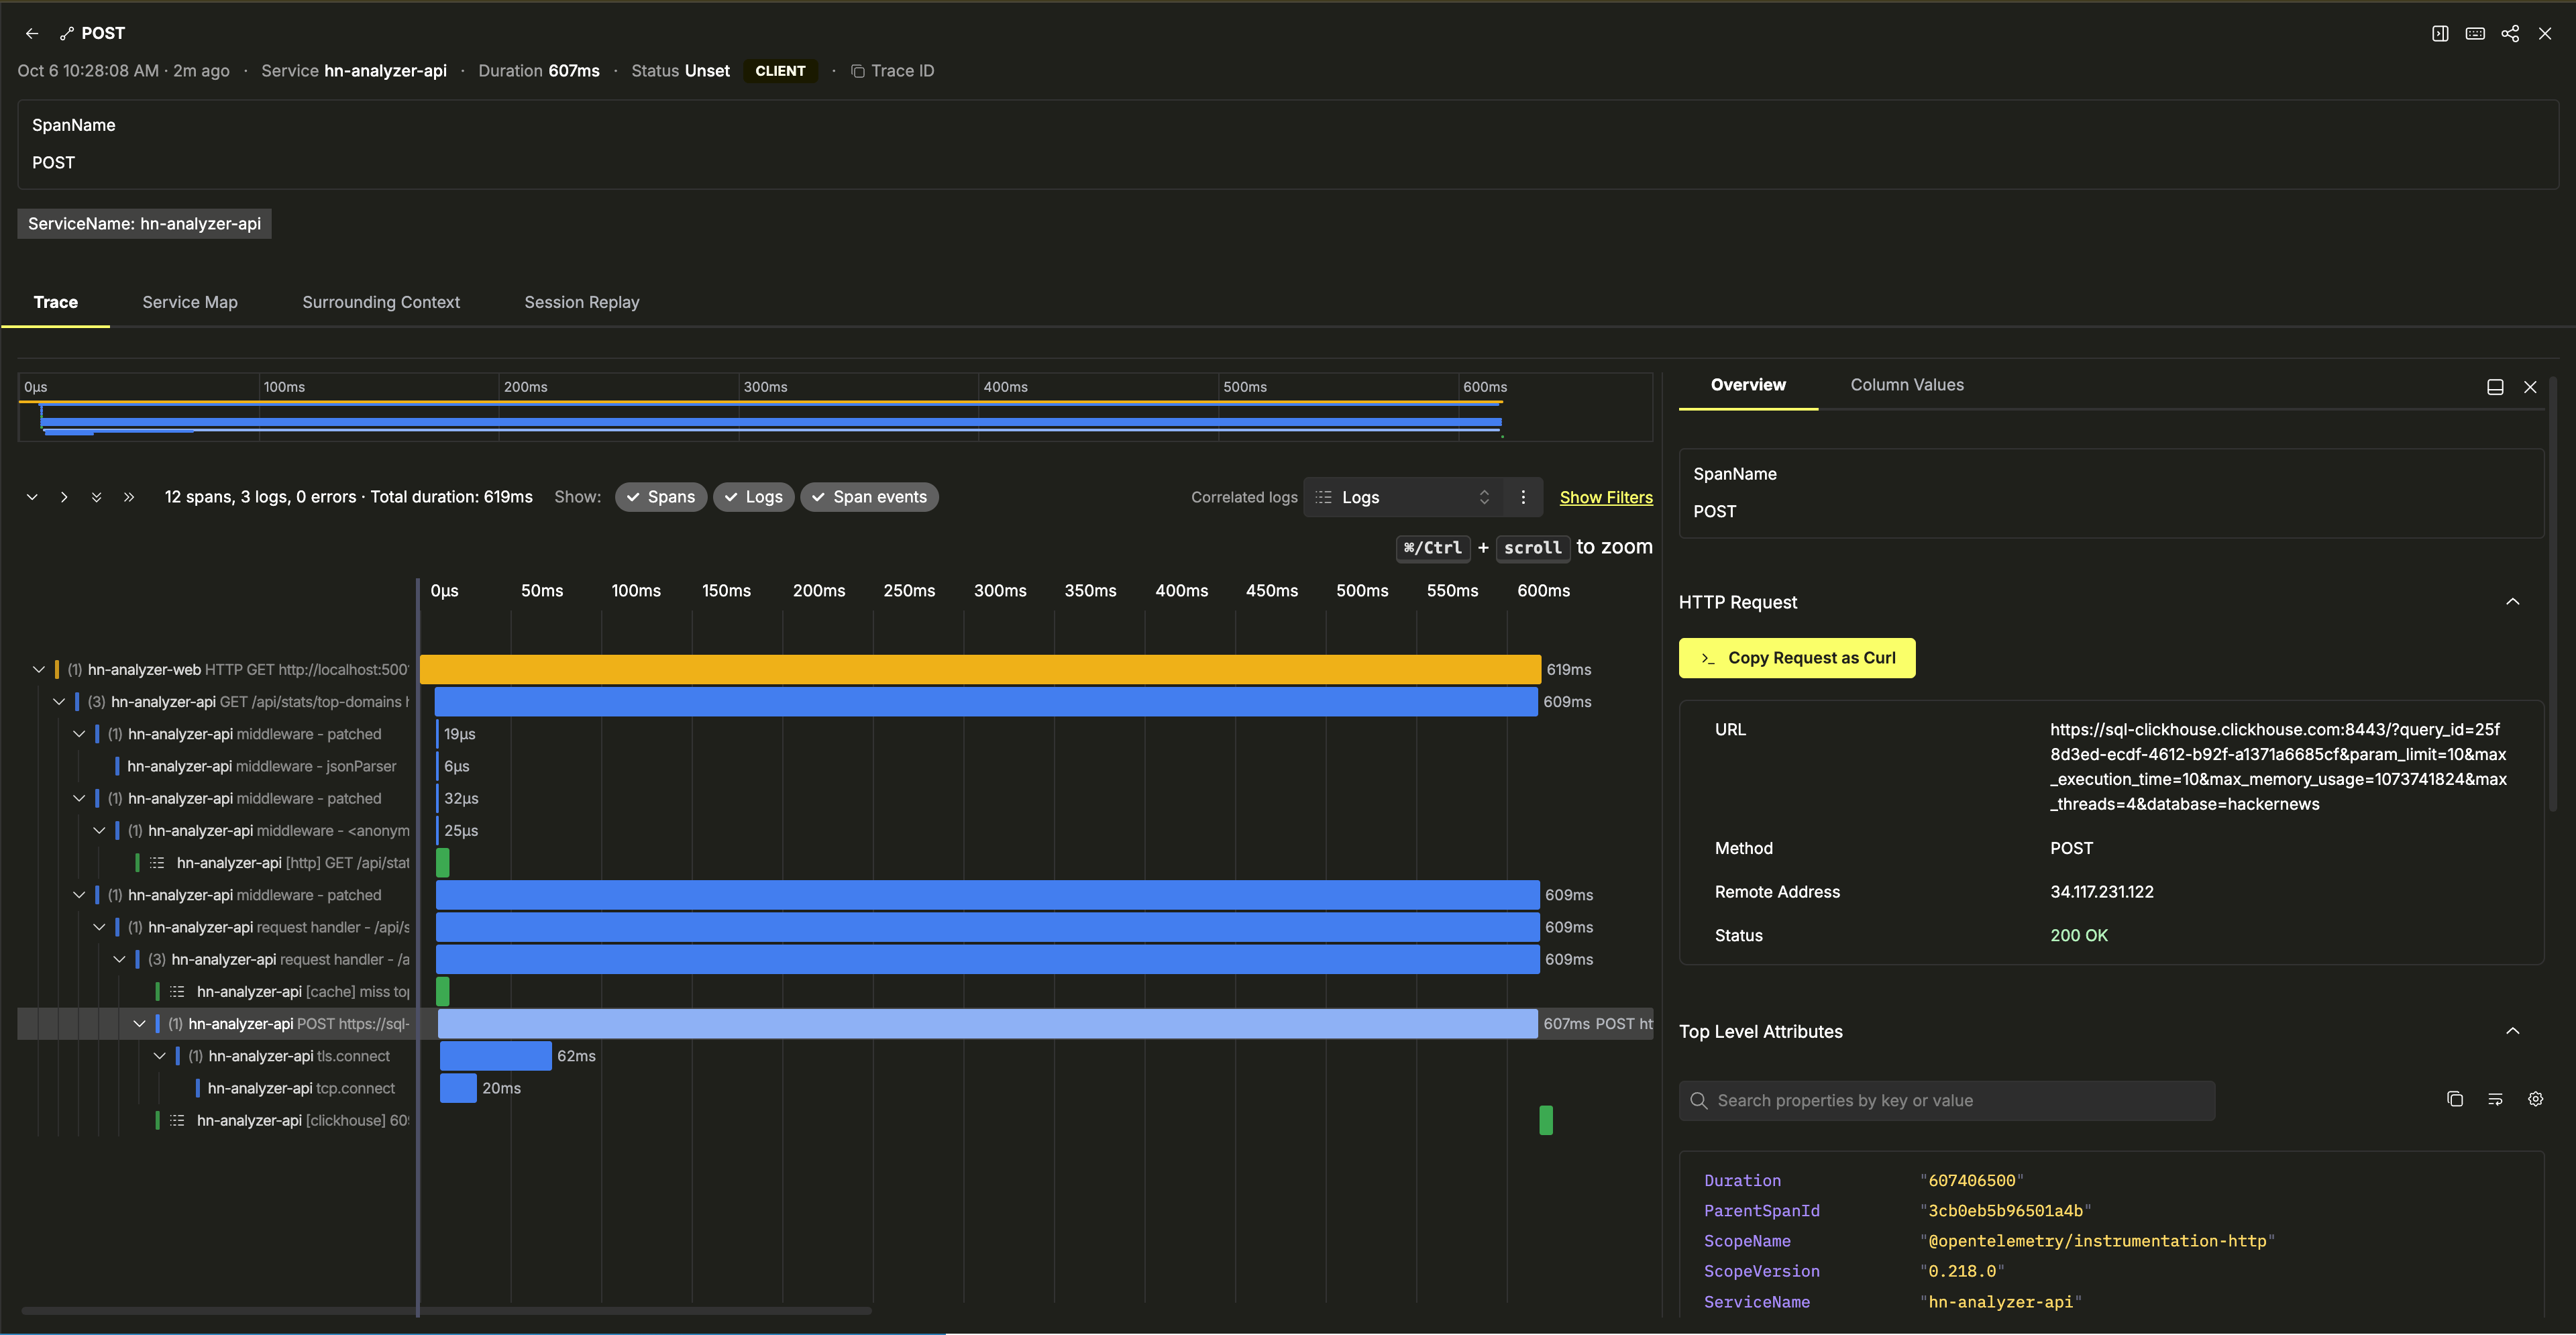
- Select the Traces source and open a request from
hn-analyzer-api. You will see the Express handler span, a child HTTP span pointing atsql-clickhouse.clickhouse.comwith real network duration, and correlatedconsole.logrecords on the same trace.
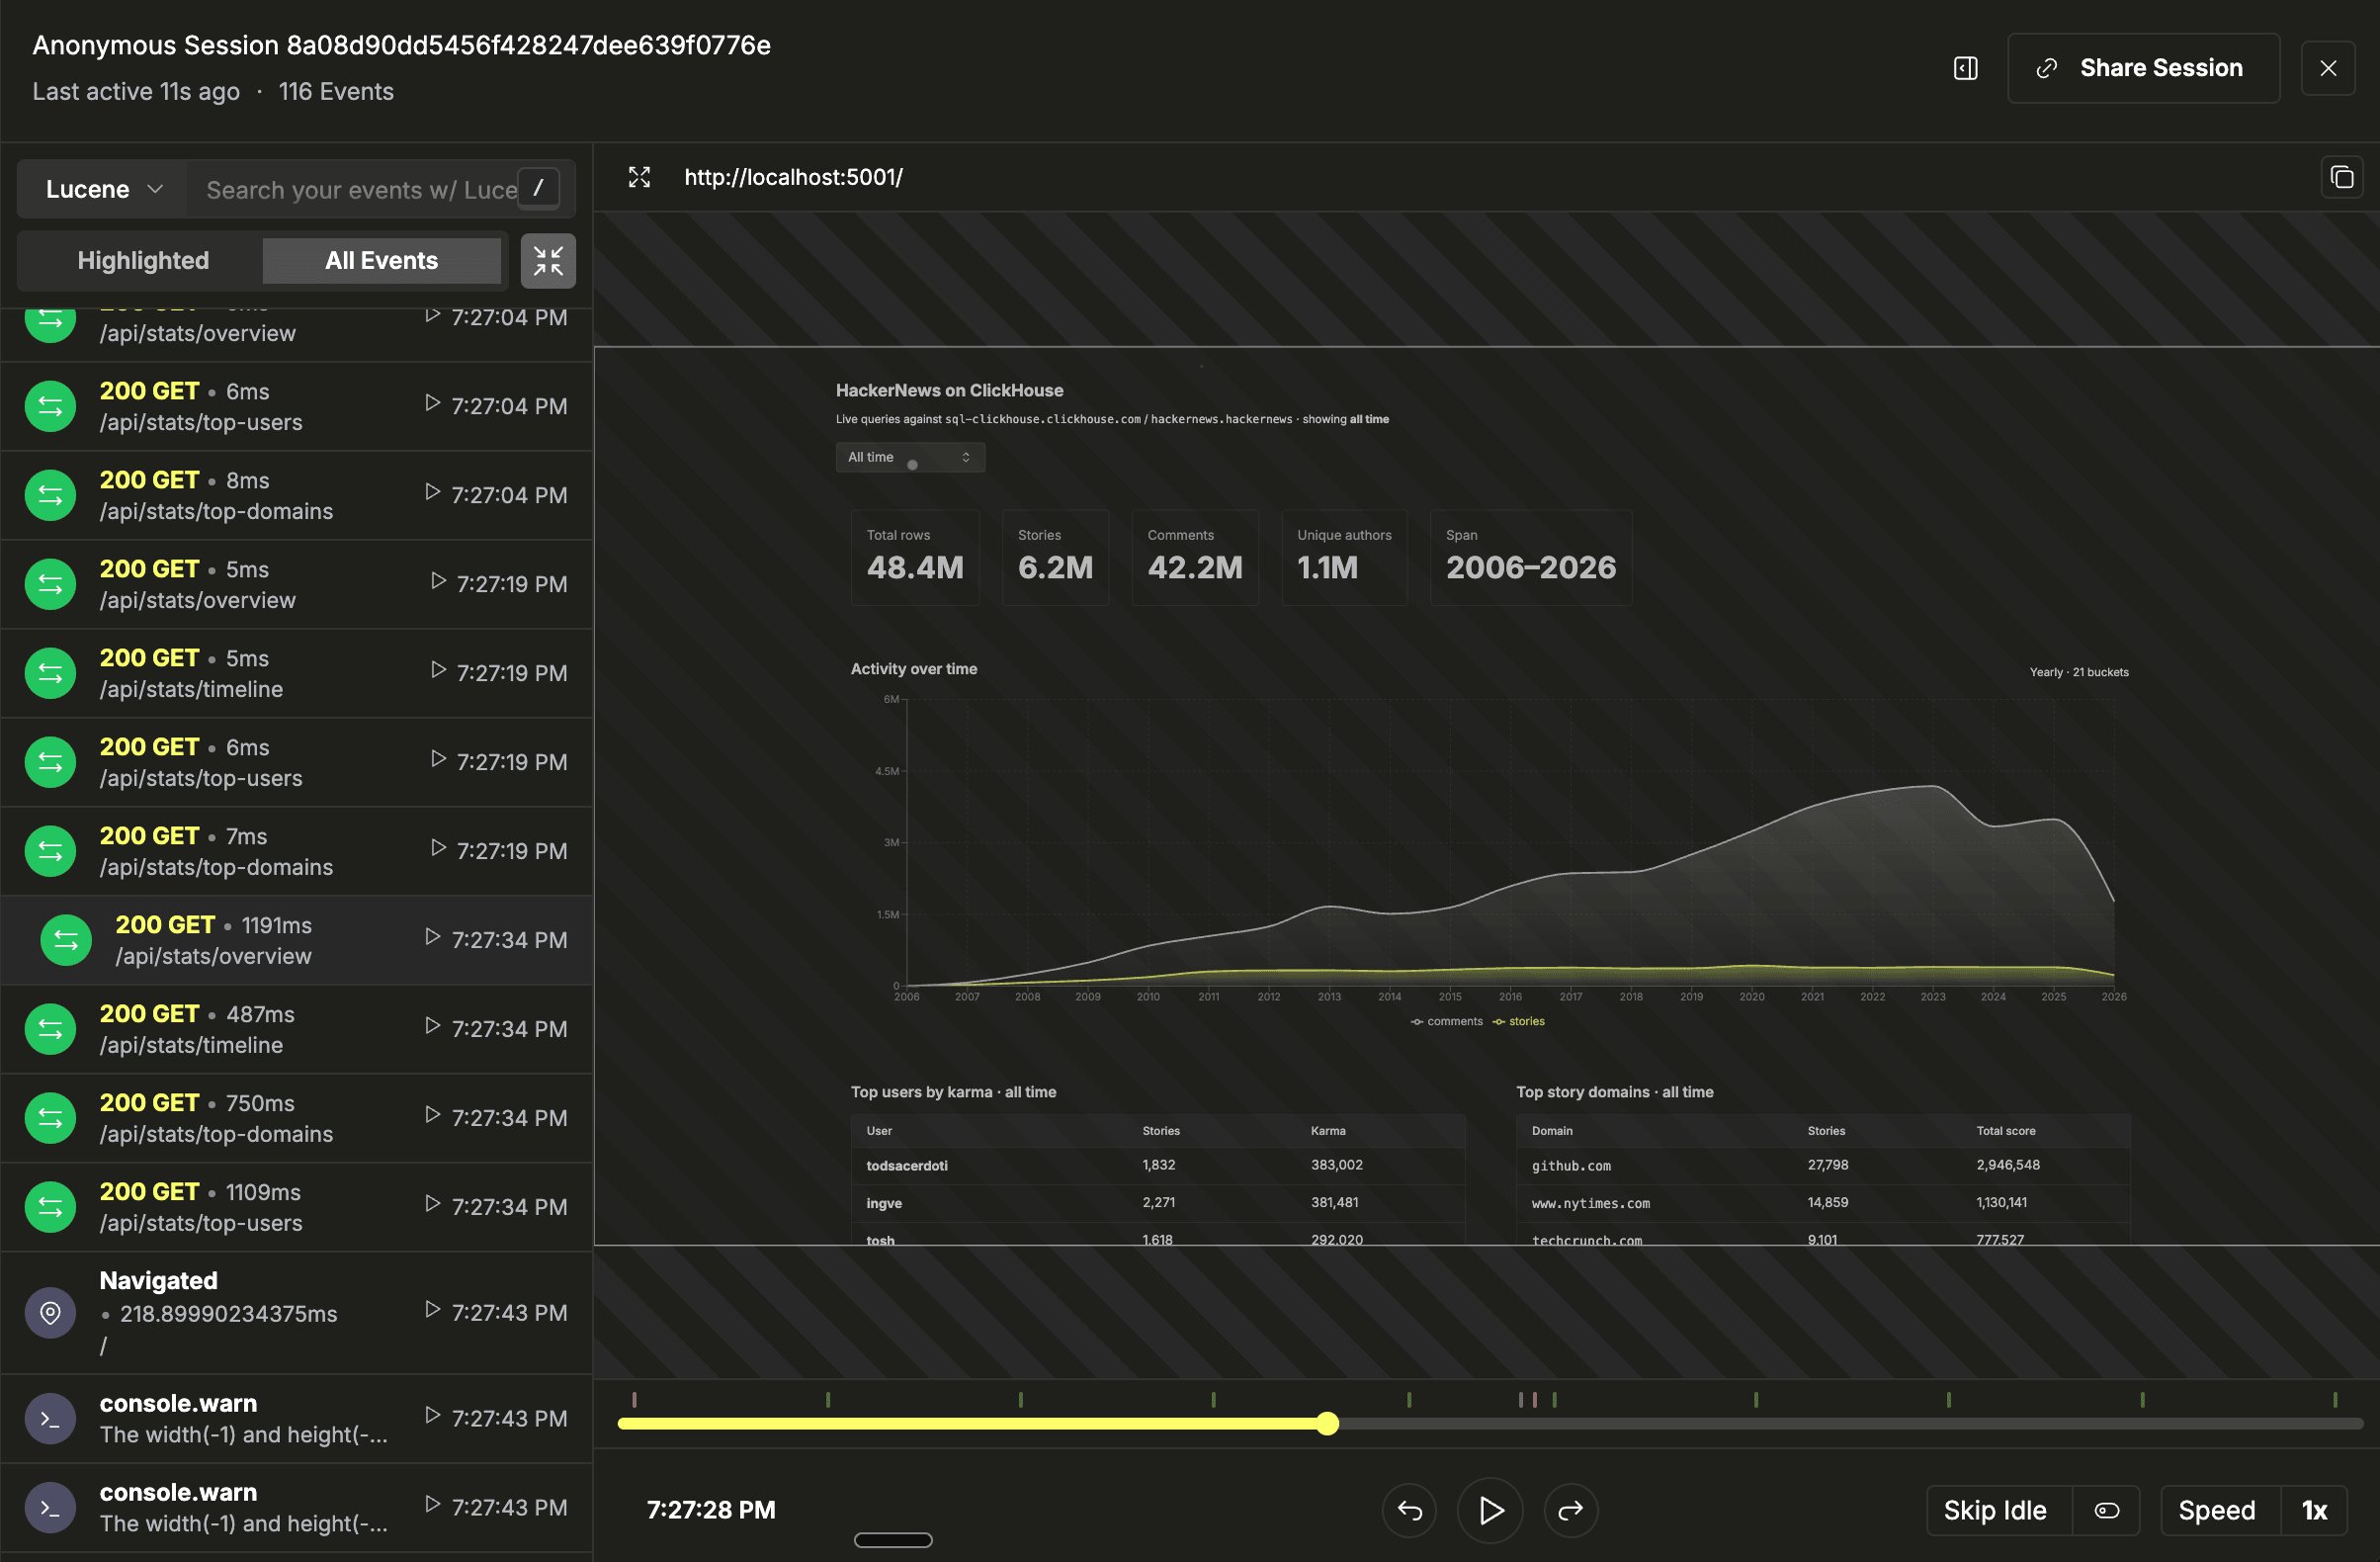
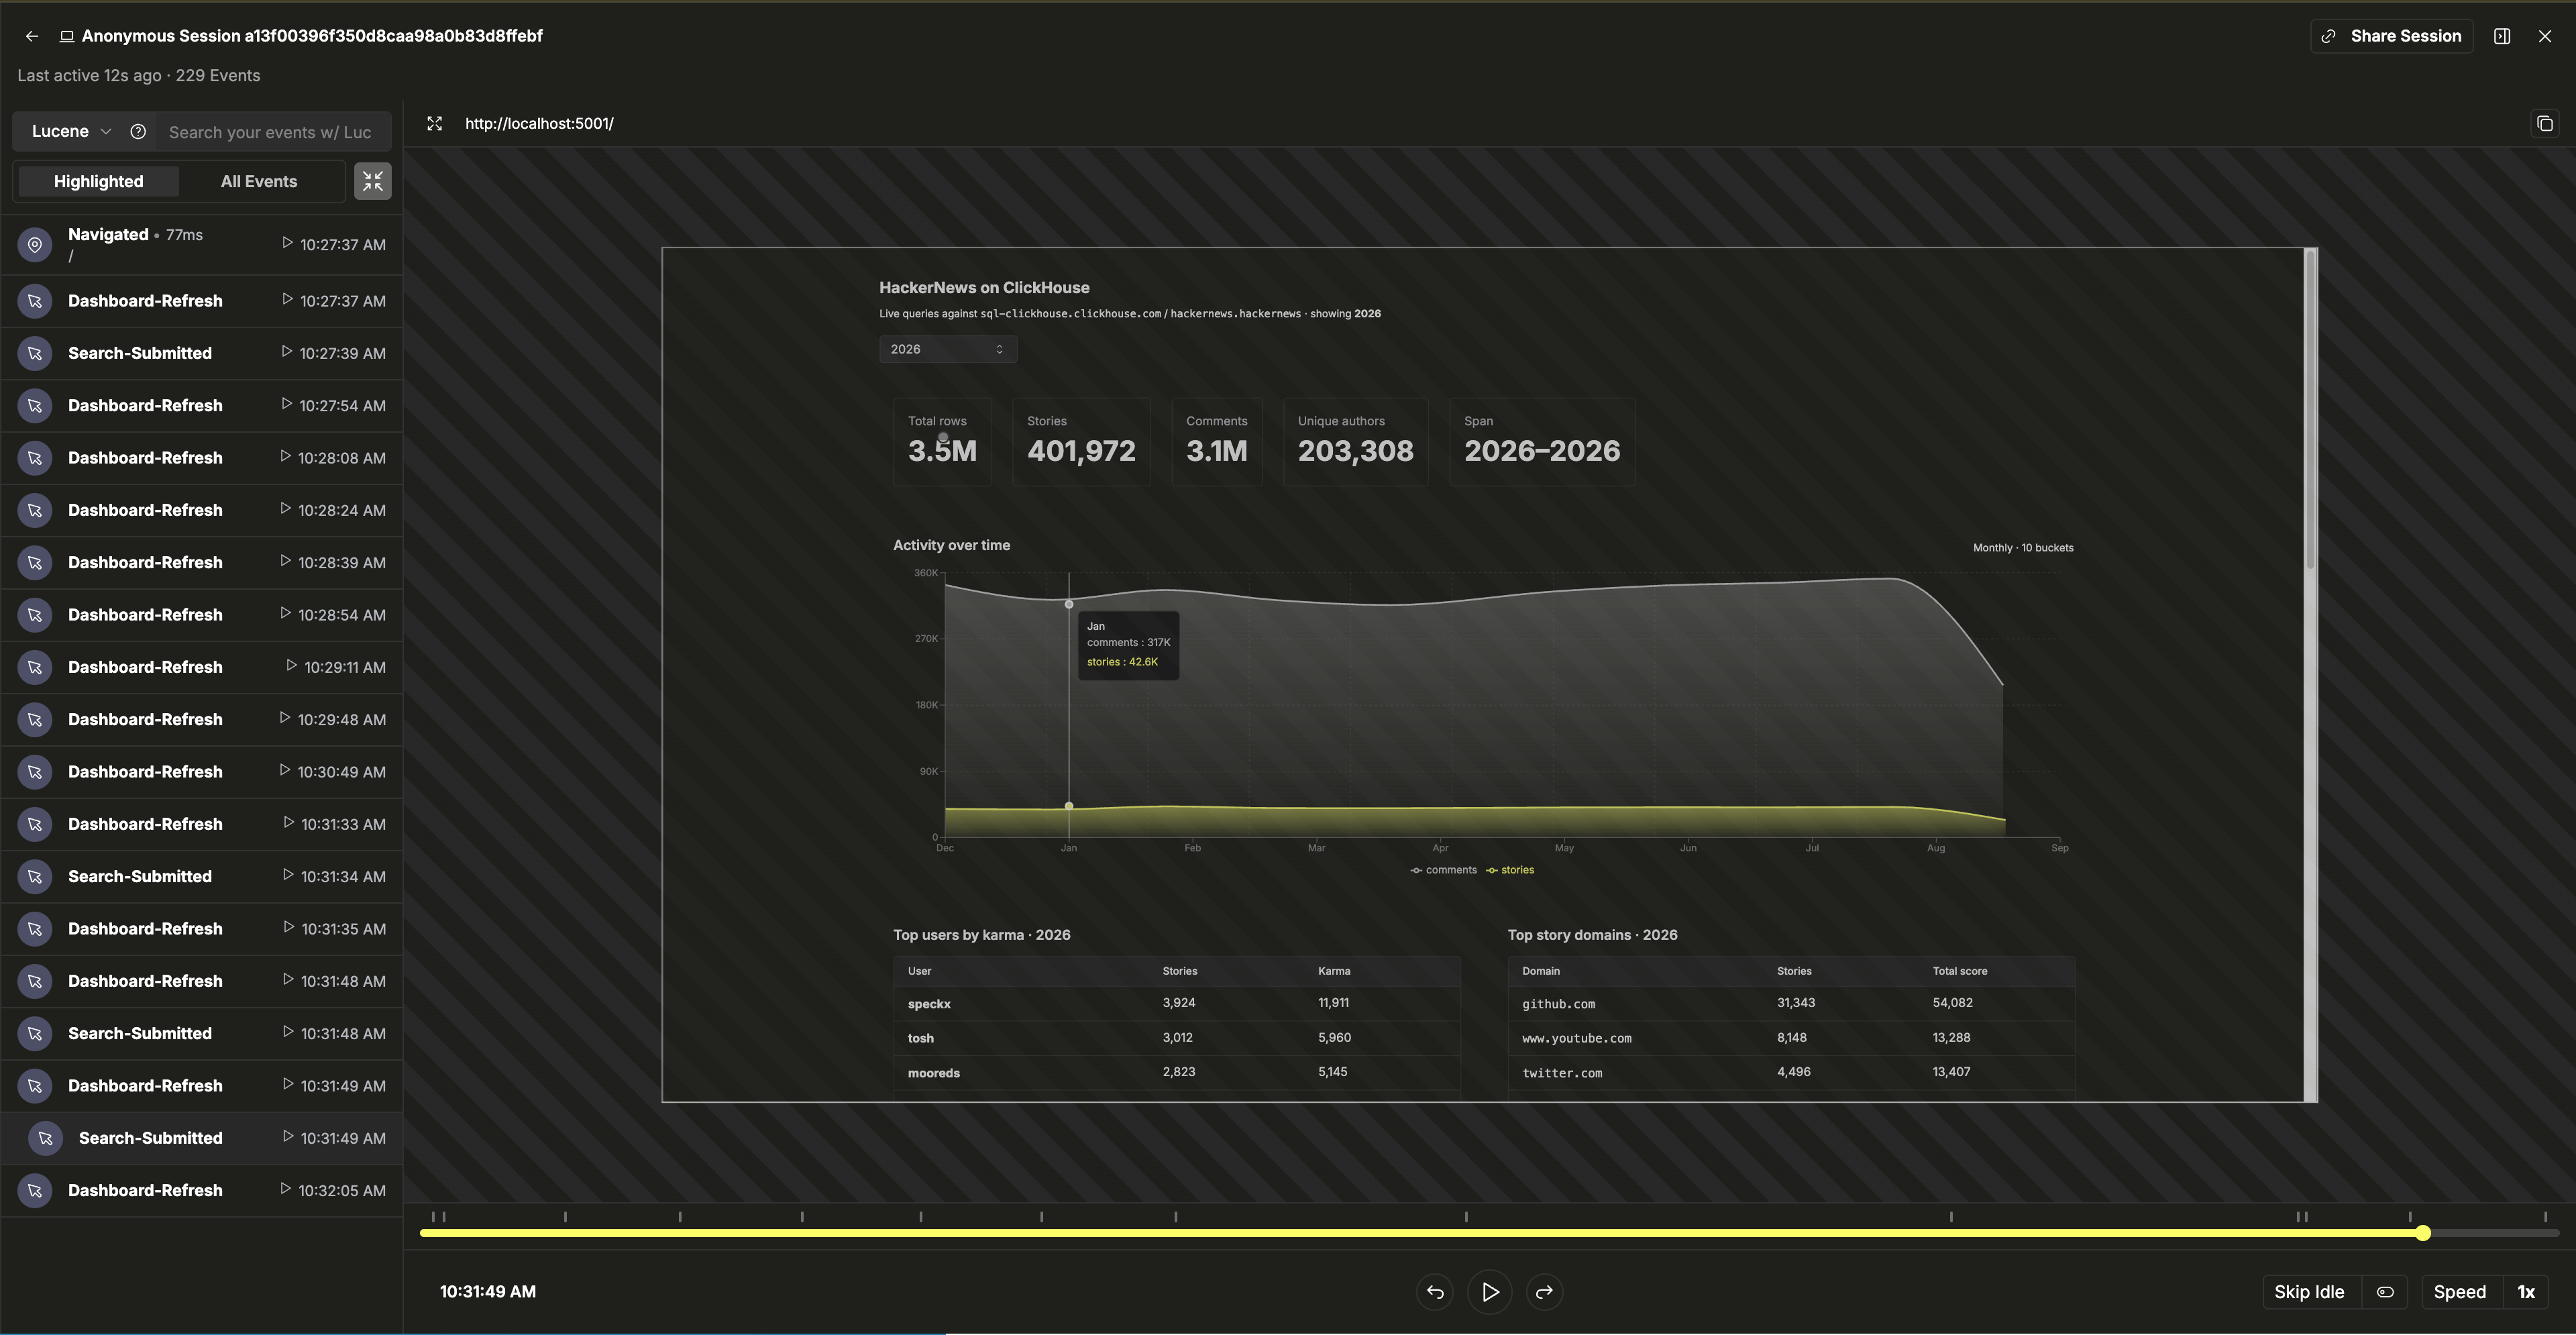
- Open Client Sessions, select a session from
hn-analyzer-web, and open Session Replay to review the browser interactions.
- Open Chart Explorer, select Time Series and the Metrics source, and choose a metric emitted by the app. Filter by
ResourceAttributes.service.name:"hn-analyzer-api", select a time range covering your test, and select Run to confirm metric data is present.
Learn more
- HackerNews Analyzer: the demo repository this guide instruments.
- Session Replay: feature overview, SDK options, and privacy controls.
- Fully managed Getting Started: connect your first data source.
- All Sample Datasets: other example datasets and guides.