

Deployment and data collection
What is the difference between fully managed and self-managed ClickHouse Observability?
What is the difference between fully managed and self-managed ClickHouse Observability?
Fully managedFully managed ClickHouse Observability is the recommended starting point. Send telemetry to the managed OpenTelemetry endpoint; ClickHouse handles the ingestion collector, schemas, infrastructure, and scaling.Self-managedSelf-managed ClickHouse Observability gives you control over ingestion, schemas, retention, and database configuration. ClickHouse Cloud hosts ClickHouse and the ClickStack UI, while you operate the ingestion collector and manage database tuning and capacity. Self-managed is not a beta offering.
Do I need to run an OpenTelemetry collector?
Do I need to run an OpenTelemetry collector?
Fully managed: You do not need to deploy an ingestion collector. Applications and telemetry generators can send data directly to the managed OpenTelemetry endpoint.You may still need a collector in your own environment to read log files or gather host and Kubernetes metrics, then forward that data to the managed collector. See Local logs and metrics and Monitoring Kubernetes for examples.Self-managed: You need a running ingestion collector connected to your ClickHouse Cloud service. Applications and agents send telemetry to this collector, which writes it to ClickHouse. We recommend the ClickStack distribution. See Ingesting with OpenTelemetry for connection instructions and the deployment guide to start a collector.
Where do I find my telemetry endpoint and API key?
Where do I find my telemetry endpoint and API key?
Fully managed: In your ClickHouse Observability service, open Team Settings → Data → Managed Telemetry and copy the OTLP endpoint and ingestion API key. Use these details when configuring your SDK, forwarding collector, or telemetry generator.Self-managed: Use the OTLP endpoint of the collector you operate and any authentication token configured on its receiver. For the ClickStack collector, if you enable
OTLP_AUTH_TOKEN, send that token in the authorization header. These are separate from the ClickHouse Cloud database endpoint and credentials that the collector uses to write data. See Ingesting with OpenTelemetry for examples.Follow the endpoint format required by the tool you are using. The sample data and demos include configuration examples for each tool.Alerting
What types of alerts does ClickHouse Observability support?
What types of alerts does ClickHouse Observability support?
ClickHouse Observability supports two types of alerts:
- Search alerts: trigger notifications when the count of matching log or trace results within a time window exceeds or falls below a threshold.
- Dashboard chart alerts: trigger notifications when a metric plotted on a dashboard tile crosses a defined threshold.
Can I alert on complex metric conditions such as ratios, p95/p99, or multi-metric formulas?
Can I alert on complex metric conditions such as ratios, p95/p99, or multi-metric formulas?
Build the calculation as a dashboard chart, then attach a threshold alert to that chart. The chart builder supports calculations such as ratios and percentiles.For calculations that require SQL, use a SQL-based chart alert. SQL alerts support Line, Stacked Bar, and Number charts. Save the dashboard to activate the alert.
Dashboards and drill-downs
Are prebuilt dashboards included?
Are prebuilt dashboards included?
Yes. Open Dashboards to find the Services, Kubernetes, and LLM preset dashboards. These dashboards display data when the relevant telemetry is being ingested and the selected time range includes that data.You can also create custom dashboards using your ingested logs, traces, and metrics. See Dashboards for how to build charts and organize them into dashboards.
Does ClickHouse Observability support parameterized dashboards or dashboard variables?
Does ClickHouse Observability support parameterized dashboards or dashboard variables?
Yes, ClickHouse Observability supports dashboards parameterized by custom filters and variables, populated by data queried from ClickHouse. These filters allow you to dynamically scope some or all of the tiles on a dashboard to a specific value (e.g., a service name, environment, or host).For details on creating dashboards and applying filters, see Dashboards.
What drill-down capabilities are available?
What drill-down capabilities are available?
ClickHouse Observability supports the following drill-down workflows:
- Dashboard-level filtering: Dashboard-level Lucene or SQL filters apply to tiles with Apply filters enabled. You can also adjust the dashboard time range.
- Custom dashboard filters: custom dashboards support explicit filter controls that are populated with values from your data, allowing users to scope participating tiles without writing queries manually.
- Click-to-view events: clicking on data in a dashboard tile and selecting View Events navigates to the Search page with relevant filters for log and trace data.
- Table row-click drilldowns: a table tile can be configured so that clicking a row opens the Search page or another dashboard, carrying the row’s values through as filters. This supports multi-level workflows, such as a service inventory that drills into a per-service detail dashboard.
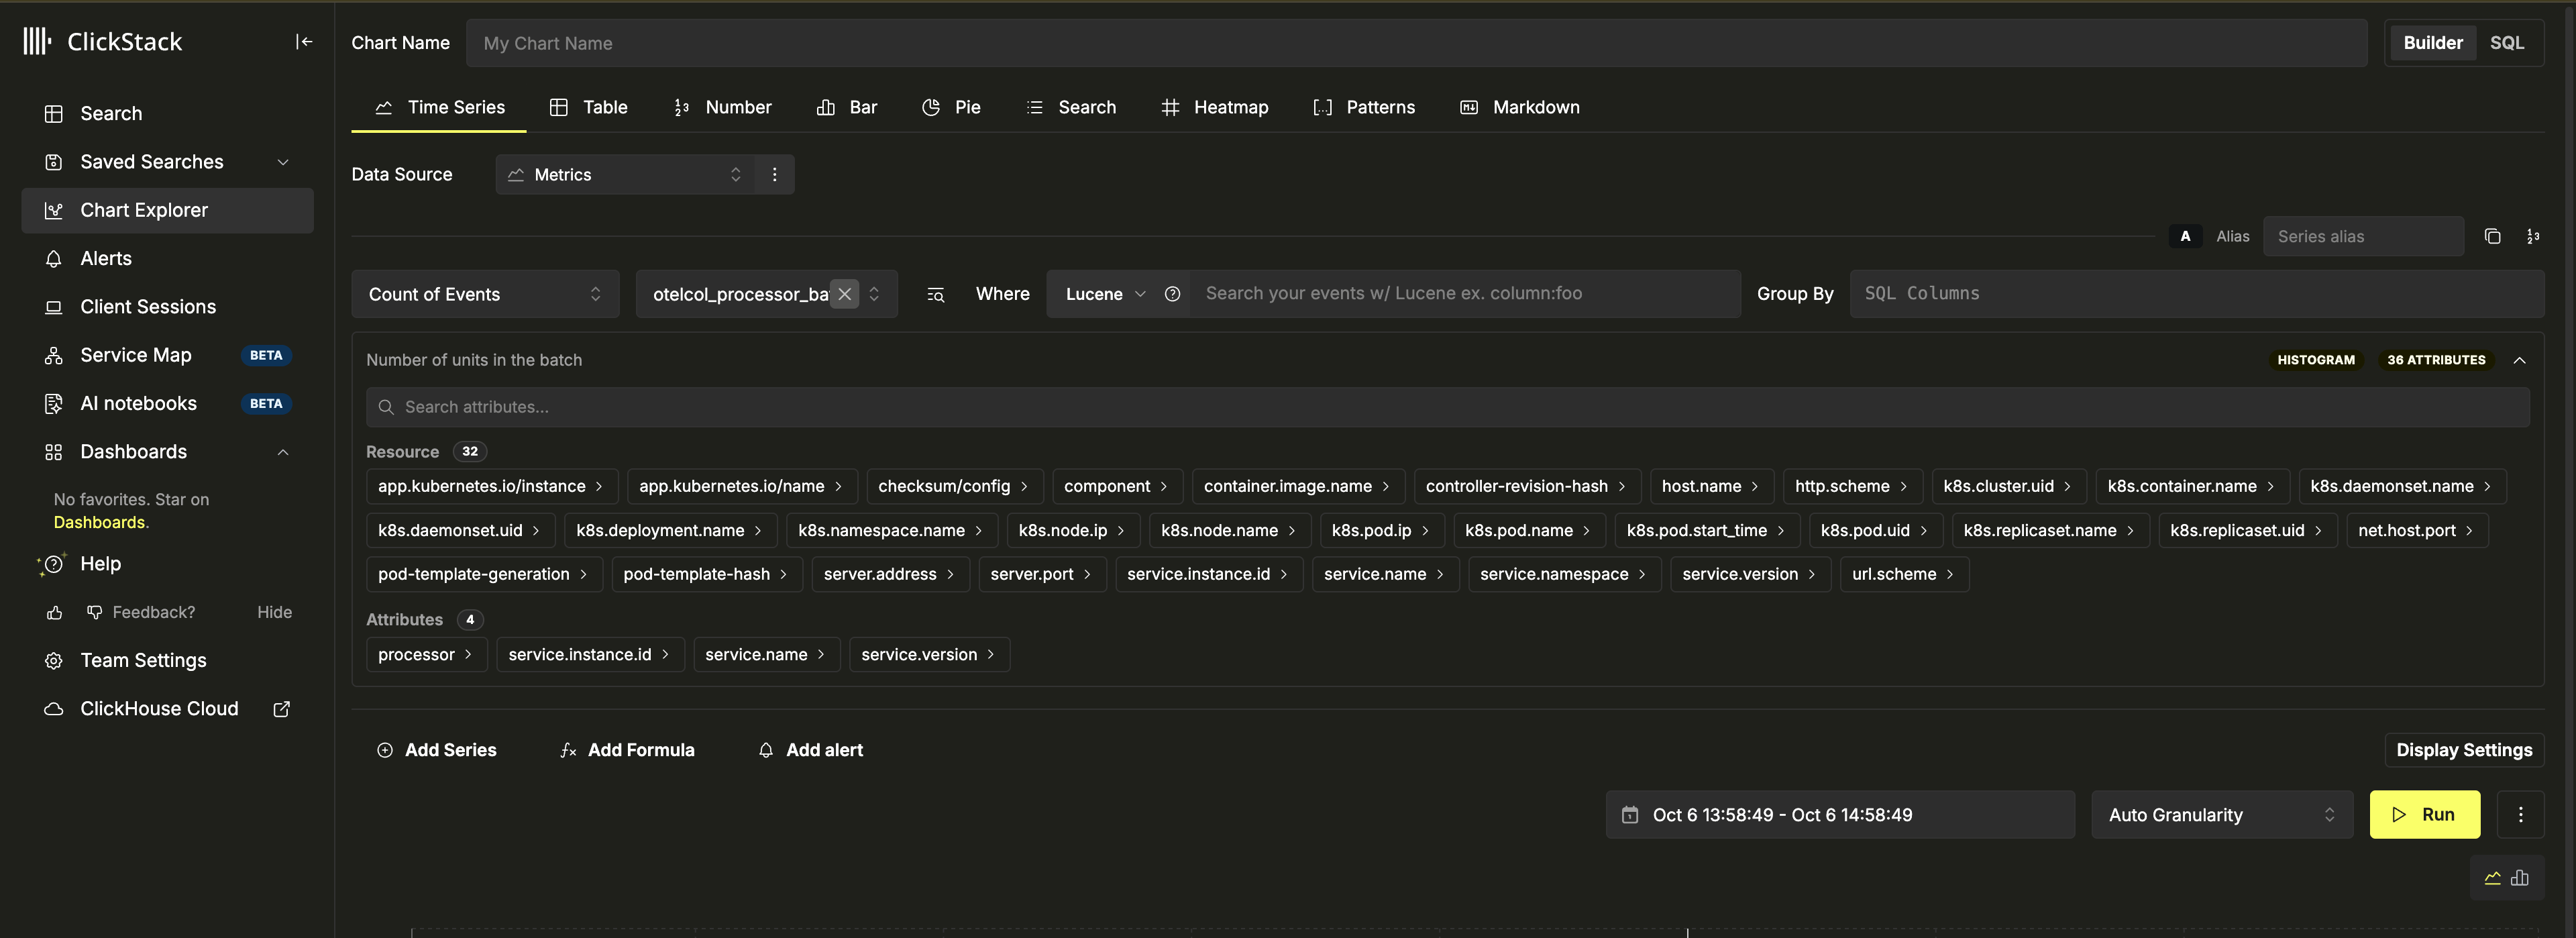
Use Search to inspect individual logs and traces. Use Chart Explorer to explore metrics.
Metrics discovery
Is there a UI for browsing and searching metrics?
Is there a UI for browsing and searching metrics?
Further reading
- Alerts: search alerts, dashboard chart alerts, and webhook integrations.
- Dashboards: creating visualizations, building dashboards, and applying filters.
- Search: querying logs and traces with Lucene and SQL syntax.
- Architecture: ClickHouse Observability components and how they fit together.