 50.9 k
Moving to ClickHouse meant 70 percent lower costs and a 10x improvement in search performance. With amazing out of the box performance and really amazing compression, we got the ingest performance we needed and the headroom to make queries fast. We're doing more and storing more with less.
- Comparisons
- Observability
ClickHouse Observability vs OpenSearch
ClickHouse Observability is the turnkey, fully managed observability solution for SREs and their agents, powered by open source ClickStack. Investigate high-cardinality logs, metrics, traces, and session replays with fast queries and affordable long-term retention.
- Cut costs. Keep more history. Retain full-fidelity telemetry for longer, without relying on sampling or roll-ups.
- Investigate faster, with agents at scale. Run concurrent searches and deep SQL analysis to explore possible causes in parallel.
- Built on open source and open standards. Keep your OpenTelemetry instrumentation and connect your preferred agents through MCP.
- Leave the platform to us. Send telemetry to one endpoint. We handle ingestion, schemas, storage, optimization, and scaling.
ClickHouse vs OpenSearch
The engine makes the difference
More work per machine. Less infrastructure to manage.
ClickHouse scales vertically on large, multicore machines, helping reduce node counts and network coordination. Provisioned OpenSearch clusters must balance Lucene shards and JVM heap as they grow, with added coordination overhead as they scale out.
- Faster queries: Vectorized, parallel execution delivers fast searches and aggregations for SREs and agents.
- Higher compression: Columnar storage and specialized codecs reduce storage and data reads.
- Native object storage: Keep full-fidelity telemetry for longer at lower cost.
This engine efficiency powers ClickHouse Observability. We handle ingestion, schemas, storage, optimization, and scaling, giving SREs and agents more time to investigate.
ClickHouse
Scale vertically

OpenSearch

Distribute across shards
Why teams moved their observability to ClickHouse

Why choose ClickHouse Observability?

Fast investigations at scale
OpenSearch distributes searches across Lucene shards. ClickHouse Observability uses one shared dataset in object storage, dividing analytical work into small granules across compute replicas for fast searches and high-cardinality aggregations. Add query capacity without repartitioning the telemetry your SREs and agents investigate.
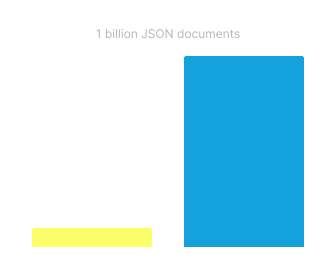

Lower costs, longer retention
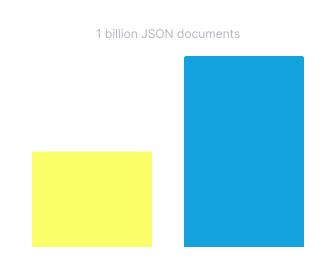
OpenSearch maintains multiple index structures to support search and analytics. ClickHouse Observability uses columnar compression and object storage to retain full-fidelity telemetry efficiently, giving investigations more historical context without relying on sampling or roll-ups.

Connected investigations. Deeper analysis.
Follow failing requests across logs, traces, metrics, and session replays, then use SQL to investigate the services and customers affected. OpenSearch also correlates signals, but its SQL plugin has join restrictions that can limit deeper analysis.

Open standards. Managed operations.
Keep your OpenTelemetry instrumentation and connect agents through MCP and SQL. Unlike operating a provisioned OpenSearch cluster, ClickHouse Observability handles ingestion, schemas, storage, optimization, and scaling, so your team can focus on investigations.
Simple volume-based pricing
Pay for logs and traces by the data you ingest, and metrics by the data points you send. We handle ingestion, schemas, storage, optimization, and scaling.
Logs, traces, and session replays
Per uncompressed GB ingested
$0.10 / GBGA rate $0.20
Metrics
Per million data points ingested
$0.05 / millionGA rate $0.10
Give agents investigation tools and deep SQL analysis
Purpose-built MCP tools let agents search logs, follow traces, and analyze event patterns and deltas. Turn useful findings into saved searches, dashboards, and alerts.
For deeper investigations, native ClickHouse SQL lets agents join telemetry, compare historical behavior, and calculate trends. OpenSearch also offers SQL and PPL, but analytical capabilities and join restrictions vary by query engine.
Your agent in
Claude Code
Your agent in
Cursor
Your agent in
Codex
Your agent on
Your framework
ClickHouse Observability
Semantic tools
Search logsFollow tracesEvent analysis
SQL
Findings saved as
Searches, dashboards, and alerts
Run more investigations in parallel
Concurrent searches compete for capacity across shards in OpenSearch. ClickHouse Observability automatically adds query compute over shared storage, independently of ingestion, so SREs and agents can investigate full-fidelity telemetry and long-term history in parallel.
Advanced controls: self-managed experience
Give agents room to investigate. Keep workloads under control.
Set query limits and usage quotas for the database identities your agents use. Run investigations on dedicated compute while dashboards and alerts use separate pools over the same telemetry.
OpenSearch provides workload-group CPU, memory, and search limits. ClickHouse also offers explicit limits on data scanned per query and cumulative allowances for query counts, read volume, and execution time.
Self-managed experience
Workload schedulingQuery complexity limitsQuotasSettings constraints
Compute pool
Agent investigations
Compute pool
Dashboards
Compute pool
Alerting
ClickHouse Observability
The open source stacks behind your observability solution
ClickStack and OpenSearch share a familiar shape: data collection, a database, and an investigation UI.
Today, both are available through managed observability products, while their underlying engines differ in query execution, compression, and analytical flexibility.


Open source ClickStackThe foundation of ClickHouse Observability.
OpenSearchSelf-managed or available through managed services.
How do the architectures differ?
OpenSearch distributes Lucene indexes across shards, combining inverted indexes, stored documents, and doc values for search and analytics.
ClickHouse Observability uses a columnar SQL engine over shared object storage, with independent compute for ingestion and investigations. We manage schemas, storage, optimization, and scaling.
ClickHouse ObservabilityPowered by ClickHouse
- Yes
Fully columnar tables with type-specific compression codecs.
- Yes
Logs, metrics, traces, and session replays on one analytical engine.
- Yes
Shared object storage accessed by independent compute replicas.
- Yes
Managed OpenTelemetry endpoint, with batching and schema optimization handled for you.
- Yes
Native JSON with typed subcolumns, including mixed types at the same path.
- Yes
Native text indexes alongside columnar storage and SQL analytics.
- Yes
Managed ingestion batches incoming telemetry into efficient columnar writes.
- Yes
Telemetry becomes queryable as ingestion batches are committed.
- Yes
Managed schema processing, with materialized views processing inserted data.
- Yes
Powered by open source ClickStack, ClickHouse, and OpenTelemetry.
- Yes
Ingestion, schemas, storage, optimization, and scaling managed together.
 Self-managed, Amazon OpenSearch Service, or Amazon OpenSearch Serverless
- Intermediate—
Lucene indexes and stored fields, with column-oriented doc values for aggregations.
- Intermediate—
Logs and traces in OpenSearch; Prometheus commonly supplies metrics through a separate integration.
- Yes
Remote-backed storage supported; Amazon OpenSearch Serverless stores indexes in S3.
- Intermediate—
Data Prepper or other pipelines; Amazon OpenSearch Ingestion provides a managed service.
- Intermediate—
Mappings determine indexed field types; conflicts require coercion or mapping changes.
- Yes
Lucene inverted indexes with configurable analyzers.
- Yes
Individual document and bulk APIs; batching improves indexing efficiency.
- Yes
Indexed documents become searchable after refresh.
- Yes
Ingest processors and Data Prepper pipelines transform incoming documents.
- Yes
OpenSearch, OpenSearch Dashboards, and Data Prepper are Apache 2.0 projects.
- Intermediate—
Responsibilities vary across OpenSearch (self-managed), Amazon OpenSearch Service (provisioned), and Amazon OpenSearch Serverless.

Lower costs, longer retention
Keep raw, unsampled telemetry for longer with efficient compression and object storage, giving investigations the history they need.

Managed from ingestion to scaling
Send telemetry to one endpoint. We handle ingestion, schemas, storage, optimization, and scaling so your team can focus on investigations.

Fast investigations at high cardinality
Search and aggregate detailed telemetry in parallel, keeping user, trace, and container IDs to pinpoint affected requests and customers.

Open source. Open standards.
Built on open source ClickStack, with OpenTelemetry, SQL, and MCP to connect the instrumentation, tools, and agents you already use.
Migrate your workload from OpenSearch today
Cut costs, speed up investigations, and unlock agentic workloads with full-fidelity telemetry and long-term history. Leave ingestion, schemas, storage, optimization, and scaling to us.

FAQs
Answers about ClickHouse Observability, migration from OpenSearch, and the options for your team.
01
ClickHouse Observability is the turnkey, fully managed observability solution for SREs and their agents, powered by open source ClickStack. Its strengths are fast SQL analytics, high query concurrency, and affordable retention of full-fidelity telemetry.
OpenSearch is built around Lucene search and distributed indexes. ClickHouse Observability combines a columnar analytical engine with managed ingestion, schemas, storage, optimization, and scaling.
02
ClickStack is the open source observability stack combining OpenTelemetry, ClickHouse, and the ClickStack UI. It provides log search, trace waterfalls, dashboards, alerts, session replay, and agent access through MCP.
ClickHouse Observability delivers that foundation as a fully managed service. You get the familiar investigation experience while we operate and optimize the platform. Teams that want to run the stack themselves can use open source ClickStack.
03
ClickHouse Observability is fully managed. We handle ingestion, schemas, the database, storage, and scaling. Just send telemetry to your managed OpenTelemetry endpoint, investigate in the ClickStack UI, or connect your agents through MCP. Pricing is volume-based: on the Scale plan, list prices are $0.20 per uncompressed GB for logs, traces, and session replays and $0.10 per million metric data points. The 50% beta discount reduces these to $0.10 per GB and $0.05 per million data points. Pricing details.
Self-managed ClickHouse Observability, formerly Managed ClickStack, gives you control over database configuration and capacity. You manage your collector, schemas, compute sizing and scaling, and read/write isolation using warehouse services, tuning the deployment as your workload changes. ClickHouse Cloud still operates the underlying infrastructure. You pay for compute and storage resources under standard ClickHouse Cloud pricing, rather than telemetry ingested.
04
Its columnar engine reads only the columns a query needs, compresses telemetry efficiently, and executes analytical queries in parallel across CPU cores and replicas. Native text indexes also accelerate log searches.
This combination supports fast searches and high-cardinality aggregations across long time ranges. OpenSearch distributes work across Lucene shards, adding coordination and result-merging overhead as investigations span more indexes.
05
Columnar compression and efficient query execution reduce the storage and compute needed to investigate large telemetry volumes. Affordable object storage makes longer retention practical, while managed operations remove the work of sizing, tuning, and scaling the database.
The underlying engine has demonstrated substantial savings: Canva reported around 70% lower infrastructure costs after optimizing its own ClickHouse deployment. ClickHouse Observability brings that engine efficiency into a managed product.
06
Logs and traces are priced per GB ingested, and metrics per million data points.
During public beta, logs and traces cost $0.10 per GB, and metrics cost $0.05 per million data points. These reflect a 50% discount from list prices of $0.20 per GB and $0.10 per million data points.
See the pricing page for full details.
07
Yes. ClickHouse Observability brings these signals into one investigation experience. Search logs, follow requests through trace waterfalls, inspect metrics, and connect backend failures to what users experienced.
Shared trace IDs and attributes help you move between signals and identify the services, requests, and customers affected.
08
Yes. Configure your OpenTelemetry SDKs or Collectors to send telemetry to your managed OTLP endpoint. You can keep your existing instrumentation and Collector processing while changing the export destination.
ClickHouse Observability handles ingestion, schemas, storage, optimization, and scaling after the data reaches the service.
09
No. ClickHouse Observability makes it practical to retain raw, unsampled telemetry without replacing historical events with roll-ups.
Efficient compression and object storage keep full-fidelity data queryable throughout your retention period. SREs and agents can inspect individual events, compare historical patterns, and investigate recurring failures with the original evidence.
10
Connect your preferred agents through MCP to search logs, follow traces, and analyze event patterns and deltas. Native SQL enables deeper investigations, including joins, historical comparisons, and trend analysis.
Fast parallel queries, long-term context, and no API rate limits let agents explore possible causes as investigations develop. Useful findings can become saved searches, dashboards, and alerts. Learn more about the ClickStack MCP server.
11
ClickHouse Observability automatically scales query compute independently of ingestion over shared object storage, without requiring you to repartition stored telemetry.
Self-managed OpenSearch and provisioned Amazon OpenSearch Service domains require shard and capacity planning. Amazon OpenSearch Serverless manages sharding and independently scales indexing and search compute. ClickHouse Observability adds a columnar SQL engine and a complete managed observability experience, including schema optimization and volume-based pricing.
12
Start by routing a representative logs or traces workload to your managed OpenTelemetry endpoint. Use existing instrumentation where possible, then recreate the searches, dashboards, and alerts your team relies on.
Lucene-style search provides a familiar starting point, while SQL supports deeper analysis. OpenSearch dashboards, PPL queries, and alert definitions need to be adapted; they do not transfer unchanged.
13
ClickHouse Observability also offers a self-managed experience for engineering teams with the expertise and resources to configure and optimize their database.
This provides more control over schemas, resource settings, external data access, and tools such as Grafana, while ClickHouse Cloud manages the underlying infrastructure. For most teams, the default fully managed experience removes that operational work.


