50,8 k

This is a guest post from Hidehiko ASAHI, a database engineer at an IT company in Japan and an AWS Community Builder
Note: Everything in this post was tested with WalShadow in Private Preview during September and October 2026, and all numbers reflect that environment at the time. Defaults and behavior may change before general availability.
Summary
- When you analyze Postgres changes in ClickHouse, how low you can keep the replication delay is a key design consideration
- Batching writes at a fixed interval lets you trade replication delay against write frequency by tuning that interval, up to the write rate the pipe can process. Reading the WAL directly, which is possible because ClickHouse manages both sides of the stack, kept the delay nearly constant as I increased the write rate
- The application wrote only to Postgres, and replication continued through schema changes and operational events without any manual intervention. Using the destination tables comes with a few caveats that stem from how WalShadow works
- Issues I reported during the Private Preview were fixed, and I was able to confirm each fix using the same steps
How this started
A while ago, I deployed the open-source walshadow on EC2 myself and used it to replicate from Postgres to ClickHouse Cloud. A member of the ClickHouse team saw that and reached out, and I got the chance to try the managed WalShadow built into ClickHouse Managed Postgres in Private Preview.
The "Sync to ClickHouse" page in Managed Postgres offers two replication methods: ClickPipes, the existing option, and the newly added WalShadow.
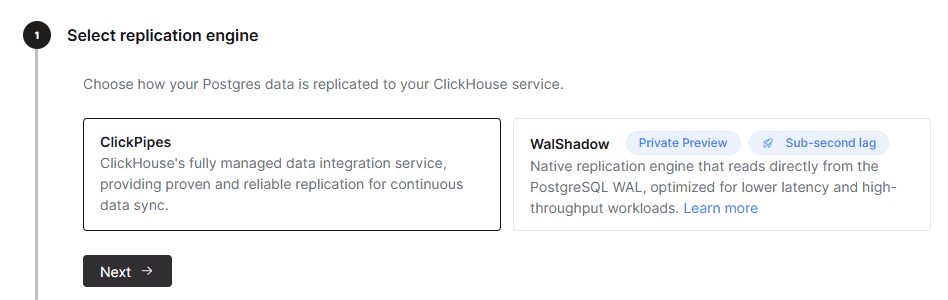 Figure 1: Choosing between ClickPipes and WalShadow in the first step of the "Sync to ClickHouse" wizard
ClickPipes is a fully managed data pipeline that receives changes through Postgres logical replication. The source does not have to be Managed Postgres; Postgres on Amazon RDS, Google Cloud SQL and others also work1.
WalShadow does not use logical replication. It receives the same physical WAL that a replica would, decodes it outside Postgres, and writes the result directly to ClickHouse as blocks2. This approach is possible because ClickHouse manages both sides of the stack, the Postgres source and the ClickHouse destination, which allows a native path from the WAL to ClickHouse. Most managed Postgres services do not expose physical WAL to customers2. The WalShadow documentation recommends choosing it when you need the lowest latency and the least replication overhead3.
Over a month of testing, I checked how much the two methods differ with the same source and the same destination, whether the aggregates in the destination stay correct when the application writes only to Postgres, and whether operational events require any action from the user.
Test environment
| Item | Details |
|---|---|
| Source | ClickHouse Managed Postgres (Tokyo, PostgreSQL 18.6). 16 vCPU for the comparison of the two methods, mostly 2 vCPU for the application and operations tests (noted in each section) |
| Destination | ClickHouse Cloud (Tokyo, 2 replicas with 16 GiB and 4 vCPU each) |
| Load | From my laptop (Python on WSL2): latency probe rows (1 row per second), bulk INSERTs with generate_series, and an order application (writing an order and its line items in one transaction at 100 orders per second) |
I used 16 vCPU for the comparison, a size the WalShadow development team also recommended, so that the source CPU would not become a bottleneck.
Measuring ClickPipes and WalShadow latency side by side
First, I set up WalShadow and ClickPipes on the same source at the same time, replicating into two databases in the same ClickHouse Cloud service. Because both methods replicate the same writes at the same moment, differences in time of day or source state do not affect the comparison.
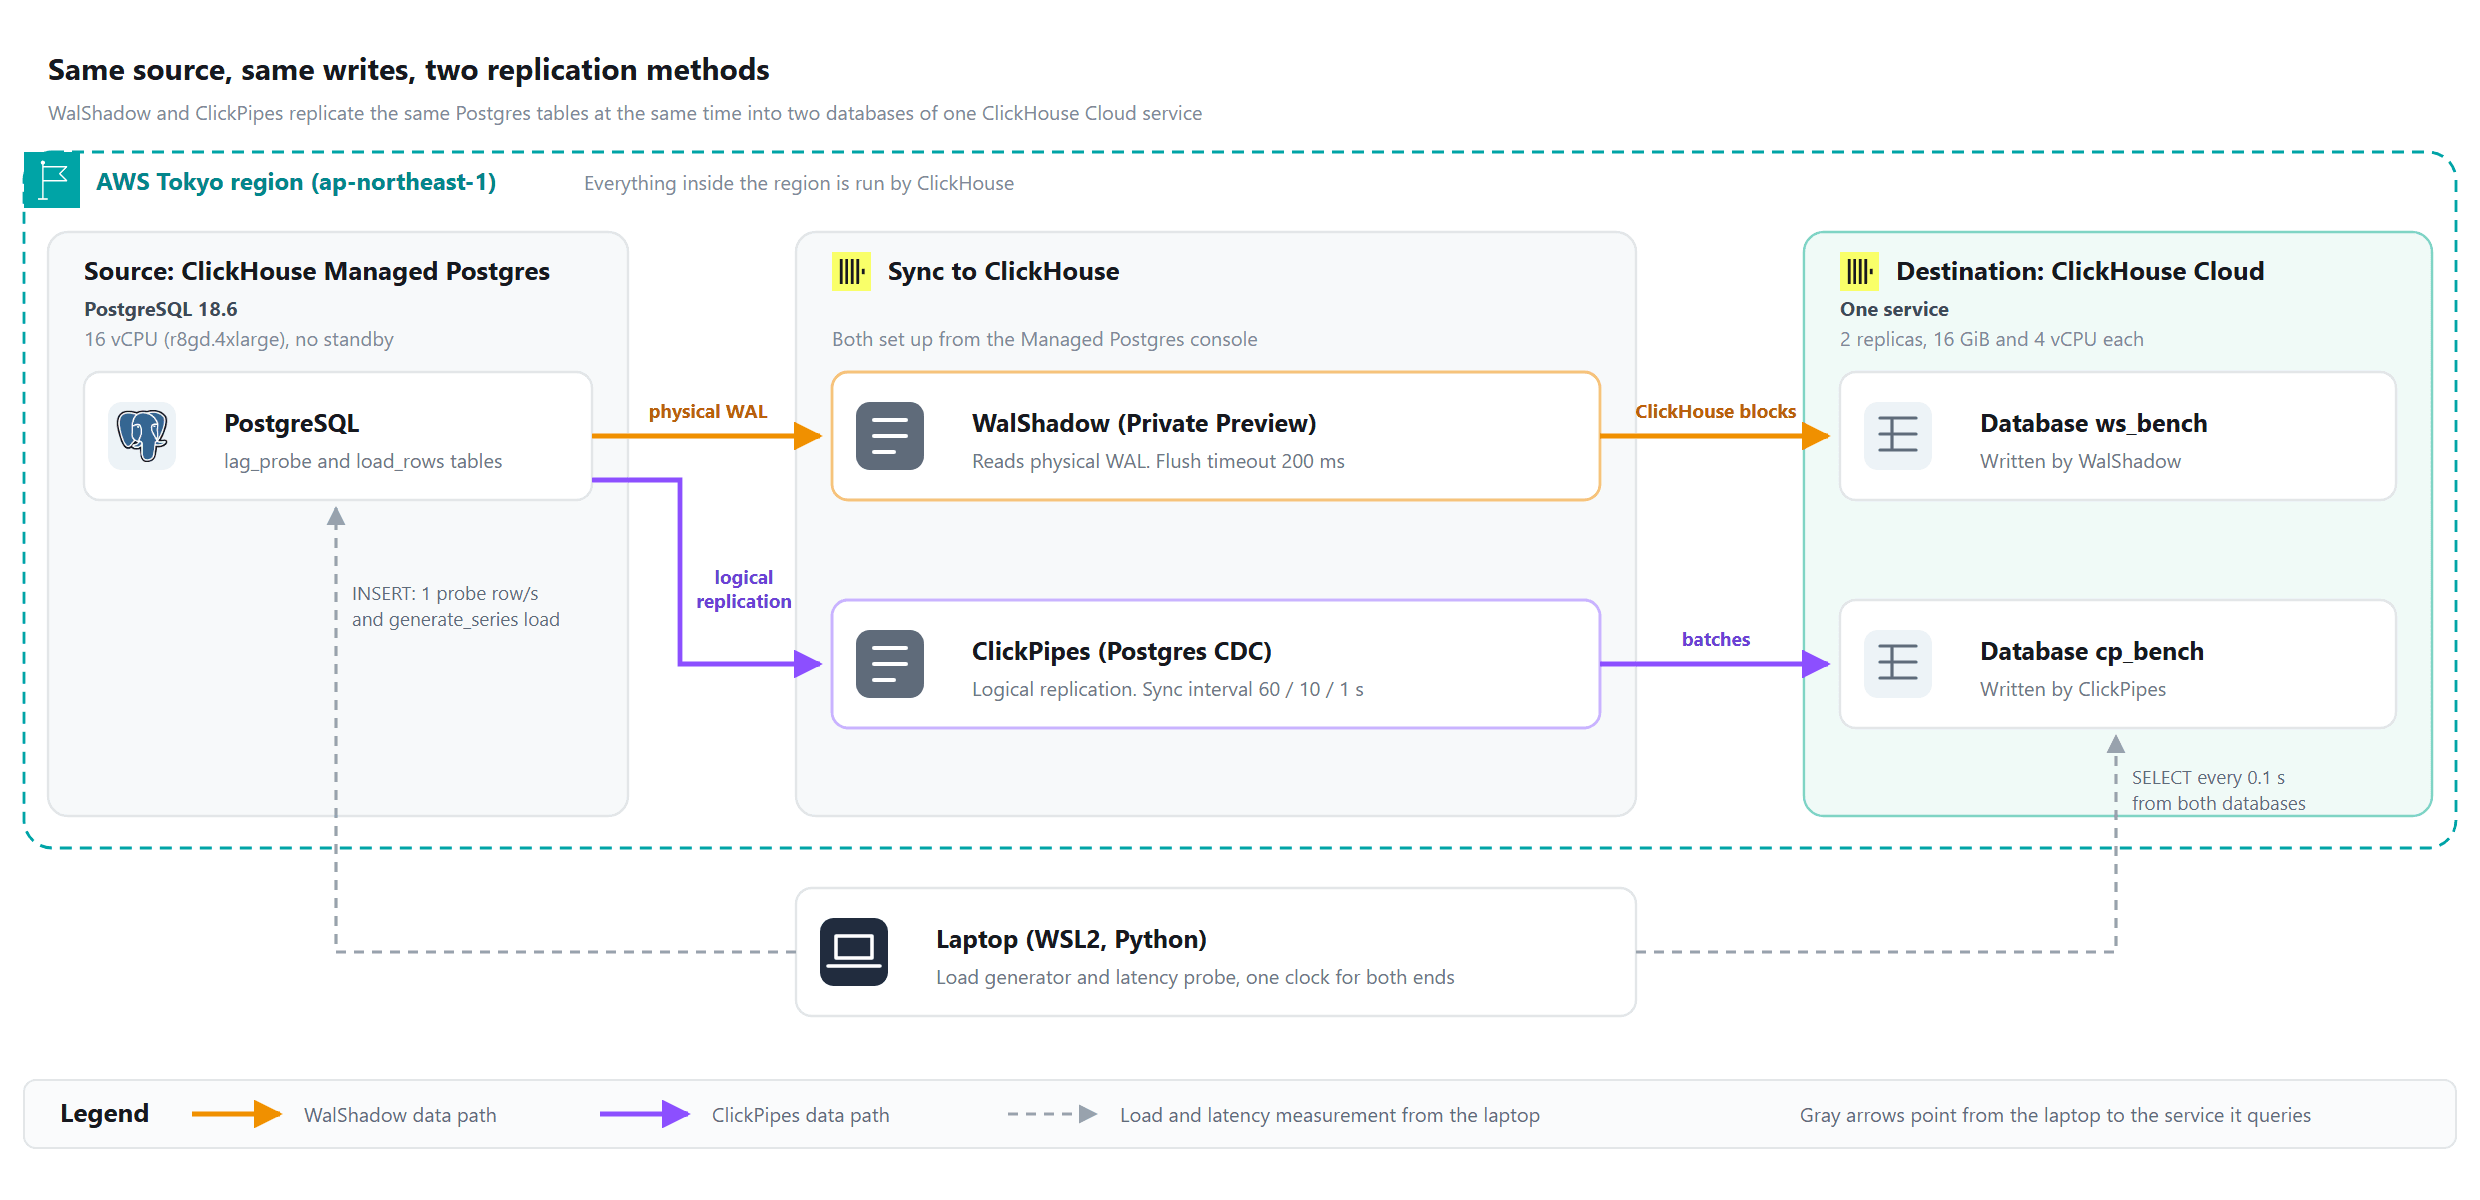 Figure 2: Test setup. One source, two methods, two databases in the same ClickHouse Cloud service
ClickPipes has two sync settings: Sync interval, which sets how often it writes to the destination, and Pull batch size, the number of rows it reads at a time (100,000 by default). It starts writing when either threshold is reached4. WalShadow has a Flush timeout setting, the maximum time it waits before writing to the destination. Partway through these measurements, the development team changed the WalShadow Flush timeout to 200 ms5. The values in the table are from after the change.
I measured latency from "the moment a row is inserted and committed on the source" to "the moment the row is visible in the destination", using the same clock on the same laptop. I polled the destination every 0.1 seconds. The table below shows three runs of 120 rows each at 1 row per second. I set the ClickPipes Sync interval to 60 seconds (the default), 10 seconds and 1 second, and measured WalShadow at the same time in every run. The docs recommend keeping the Sync interval above 10 seconds; I used 1 second only to see how it would behave4.
| ClickPipes Sync interval | ClickPipes median / max | WalShadow (measured at the same time) median / max |
|---|---|---|
| 60 s (default) | 31.10 to 31.14 s / 60.62 to 60.69 s | 0.38 to 0.40 s / 0.49 to 0.75 s |
| 10 s | 5.56 to 5.60 s / 10.68 to 10.74 s | 0.38 to 0.39 s / 0.48 to 1.42 s |
| 1 s | 1.43 to 1.44 s / 1.72 to 1.75 s | 0.38 to 0.40 s / 0.47 to 0.49 s |
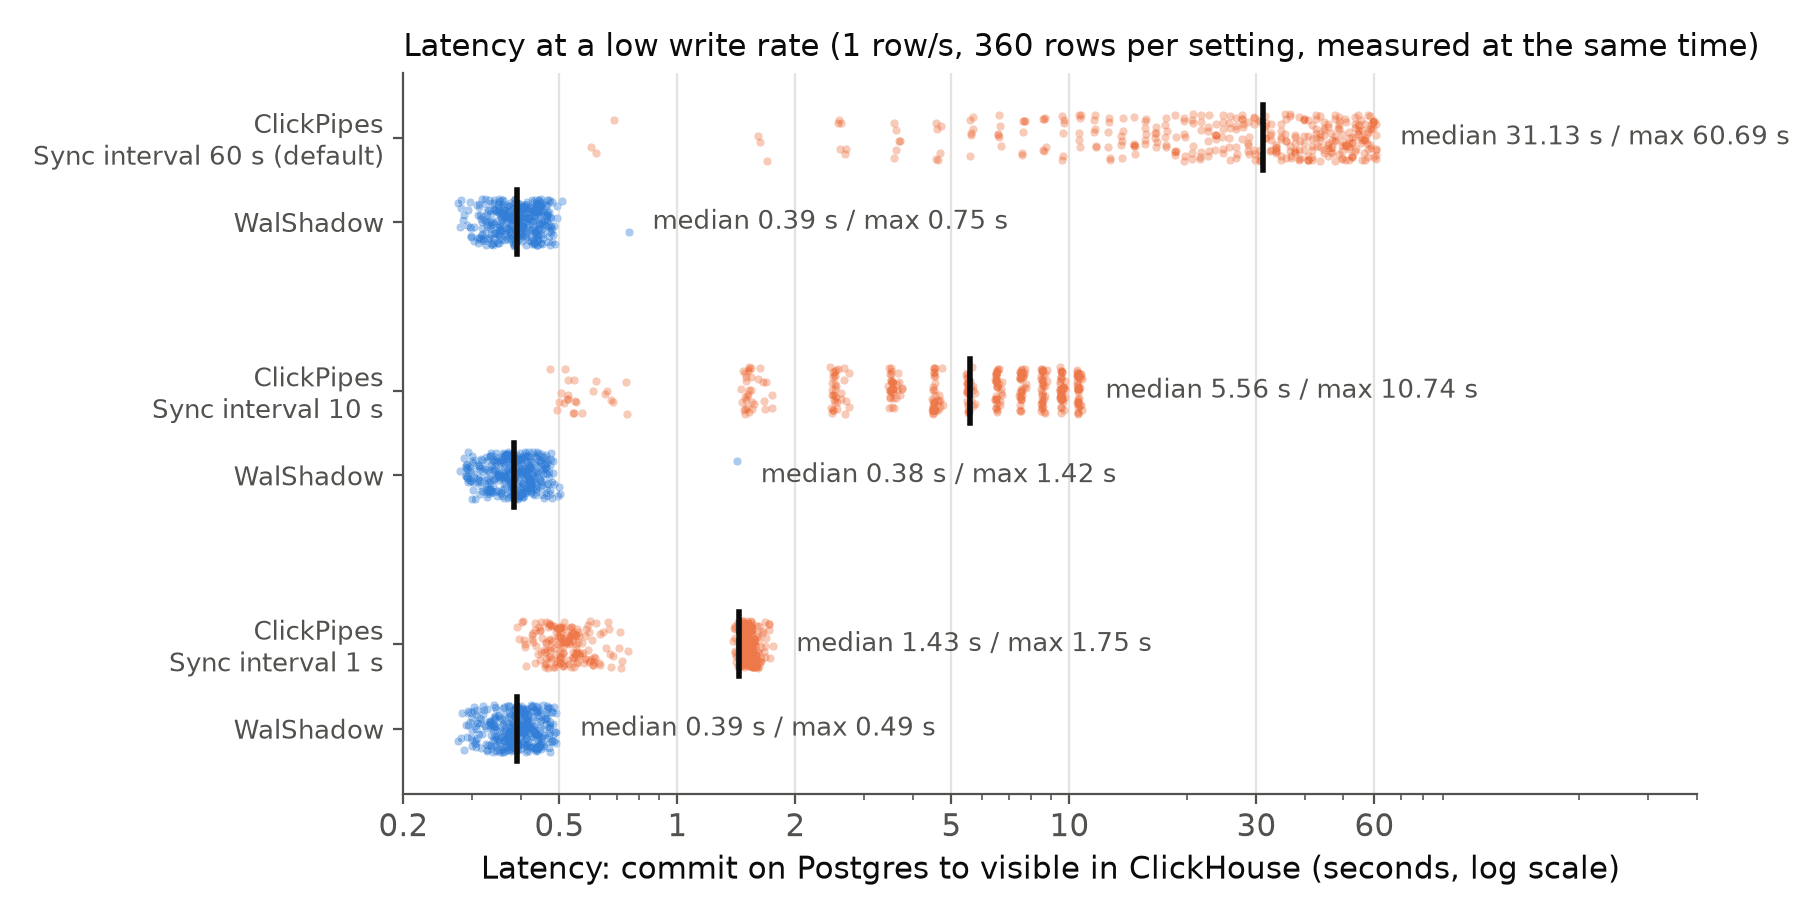 Figure 3: Latency distribution for ClickPipes and WalShadow at a low write rate (1 row per second, 360 rows per setting; black vertical lines mark the medians)
ClickPipes latency is governed by the Sync interval you choose. The maximum was almost exactly the Sync interval. When there are more writes, ClickPipes starts writing at 100,000 rows without waiting the full 60 seconds, so latency drops even lower than at 1 row per second. If a delay of tens of seconds is fine for your use case, the default works as is, and if you need fresher data, you can shorten the interval, as long as the write rate stays within what the pipe can process (see below).
WalShadow's median latency was around 0.4 seconds in every run. The maximum reached 1.42 seconds once. Next, I raised the write rate step by step from 1,000 to 200,000 rows per second (3 minutes per step). The WalShadow median stayed between 0.37 and 0.41 seconds at every step, and the maximum at 200,000 rows per second was 1.71 seconds. CPU usage on the source (16 vCPU) at that point was about 10%.
For ClickPipes, I measured the same steps at the same time as WalShadow with the default Sync interval of 60 seconds, and later repeated them on a fresh source of the same size (16 vCPU) with the Sync interval set to 1 second. The 1-second run had no WalShadow attached, and the other settings, such as the Pull batch size of 100,000 rows, were left at their defaults. Each step waited for the destination to catch up before the next one started.
| Write rate (rows/s) | ClickPipes, Sync interval 1 s: median / max | ClickPipes, Sync interval 60 s (default): median / max | WalShadow: median / max |
|---|---|---|---|
| 1,000 | 1.50 s / 1.75 s | 31.26 s / 60.79 s | 0.38 s / 0.48 s |
| 5,000 | 1.48 s / 1.76 s | 10.37 s / 19.93 s | 0.40 s / 0.51 s |
| 20,000 | 1.00 s / 1.89 s | 3.16 s / 5.31 s | 0.37 s / 0.50 s |
| 50,000 | 1.48 s / 2.06 s | 2.15 s / 2.81 s | 0.40 s / 0.51 s |
| 75,000 | 43.8 s / 87.6 s | 36.8 s / 130.2 s | 0.41 s / 0.54 s |
| 100,000 | 87.2 s / 173.6 s | 78.0 s / 153.9 s | 0.40 s / 0.52 s |
| 200,000 | 258.9 s / 522.6 s | 154.6 s / 306.8 s (114 of 180 rows arrived within the measurement) | 0.38 s / 1.71 s |
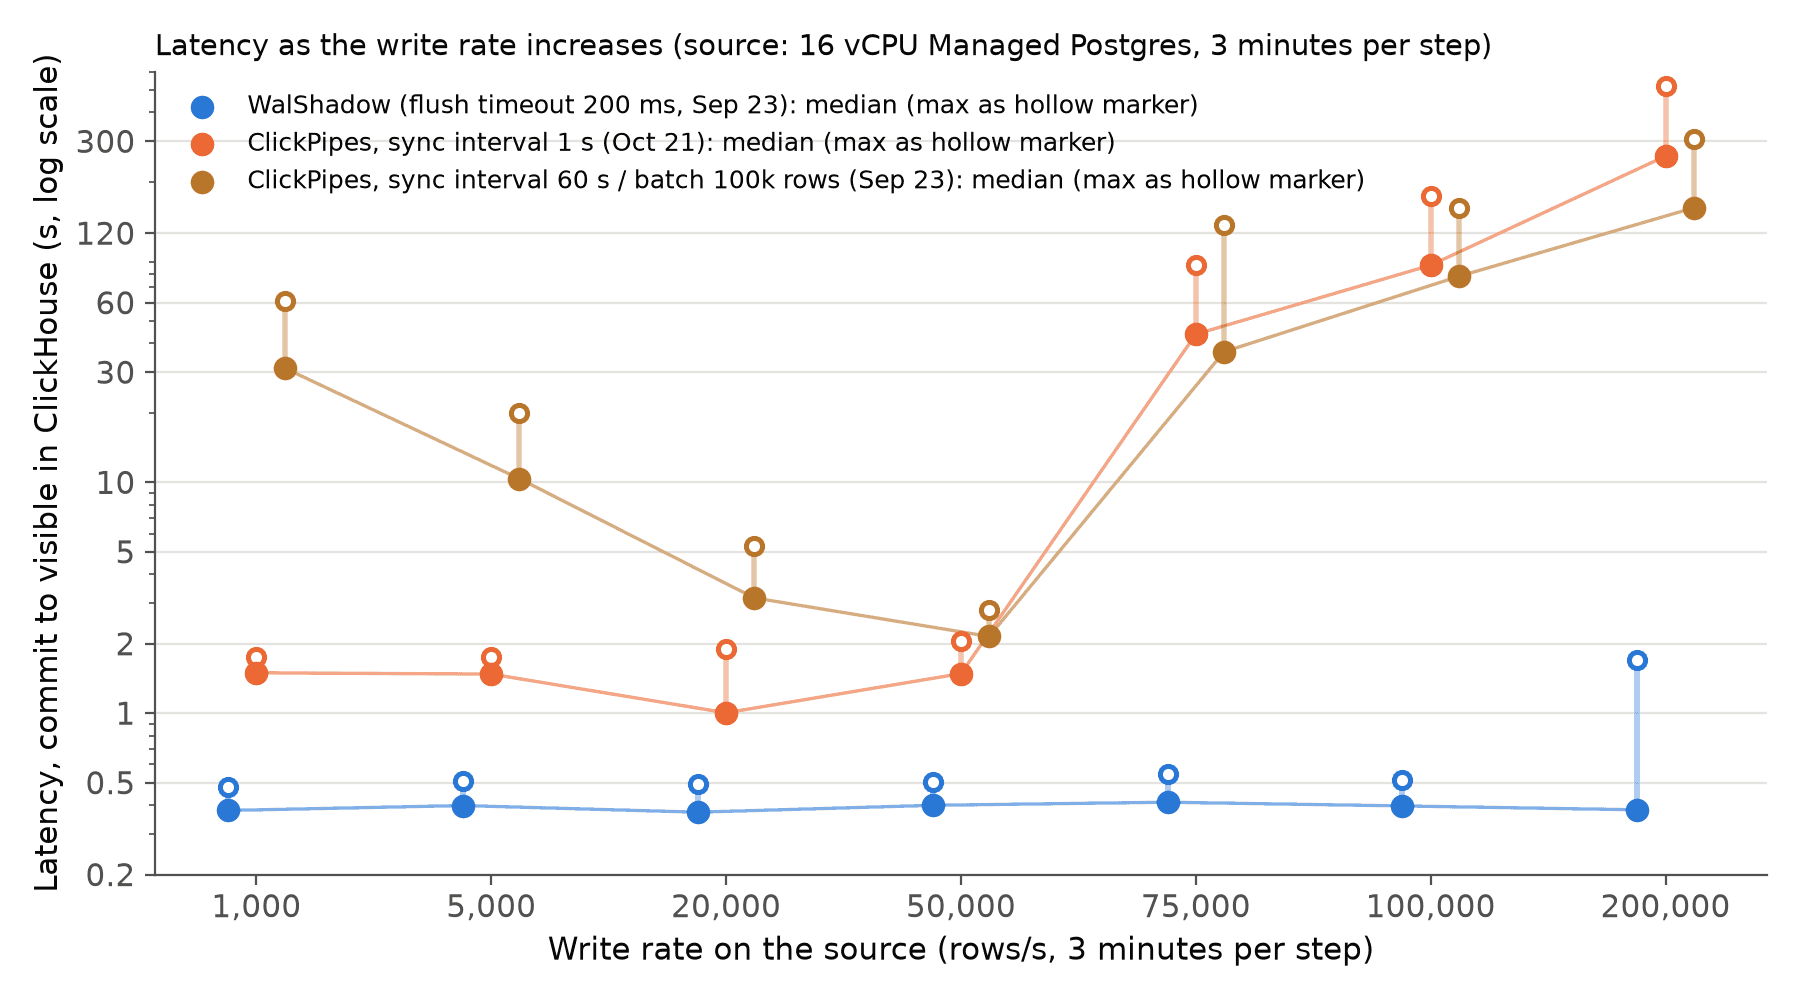 Figure 4: Latency as the write rate increases (3 minutes per step, median and max, log scale)
Up to 50,000 rows per second, ClickPipes latency followed the settings: 1 to 1.5 seconds with the 1-second interval, and a few seconds even at 60 seconds, because the 100,000-row batch fills up first. From 75,000 rows per second, latency kept growing within the step with either setting. At 75,000 rows per second with the 1-second interval, the median was 15 seconds in the first minute and 74 seconds in the last minute. Judging from how long the destination took to catch up after each step, ClickPipes processed about 50,000 rows per second at every step, which is 180 million rows per hour. A shorter Sync interval reduces how long rows wait before they are written, but it does not change how much the pipe can process. Source CPU usage stayed at about 10% here too, so the source had headroom. I also scaled the ClickPipe's own compute from 2 to 8 vCPU in its settings and repeated 75,000, 100,000, and 200,000 rows per second with the 1-second interval. The median latency was 34.7, 72.5, and 224.6 seconds, an improvement of 10 to 20 percent. Calculated from the catch-up time, the pipe processed about 55,000 rows per second, and its CPU usage stayed at about 2 of its 8 cores.
Along with latency, I also checked that both methods replicated the same data. At each checkpoint, nine times in total, I compared row counts, sums, and MD5 hashes across the source and the two destinations, and all of them matched. In the last check, all 85,618,571 rows in the load table matched in all three places. In the later ClickPipes run, the 108,178,569 rows on the source and the destination also matched after all steps.
Can the application just write to Postgres?
From here on, I used only WalShadow to test a pattern where the application writes only to Postgres and aggregates are read from ClickHouse. The source was a 2 vCPU instance.
I ran the order application for 30 minutes. Every 30 seconds, I aggregated the order count and revenue in the destination for the 5-minute window ending 1 minute earlier, and compared the results with Postgres at that same point in time. All 61 comparisons matched. Along the way, I added a column to the orders table, created a new table that the application started writing to, and created an index. In all three cases, replication continued without any action from me. The added column appeared in the destination right away, and the new table was already in the destination when I checked about 11 seconds after creating it. After stopping the load, a full comparison also matched, down to counts, sums and the breakdown by status.
New tables are picked up automatically when you choose "Select all tables" for the schema in the table selection step of the WalShadow wizard. If you select tables individually, tables created later are not included. For an application that keeps adding tables, choosing "Select all tables" means you do not have to add new ones manually later.
WalShadow adds three columns to the destination tables: _is_deleted for deletes, _commit_ts for the commit time, and _lsn for the WAL position. Here are the caveats for using the destination tables. None of them are bugs; they follow from how WalShadow works.
- When one transaction writes to two tables, the destination may briefly show the changes in only one of them. This is because WalShadow builds blocks per table and writes them in parallel2, and the open-source documentation lists this as a limitation6. In the end, the state matched
- If you create a materialized view on a destination table, rows that arrive through CDC also flow into the view. New versions of updated rows and rows with
_is_deleted = 1are passed through as-is, so you need to decide how the view handles row versions and deletes - For rows loaded from the backup during the initial load,
_commit_tsand_lsnhold the same fixed value on every row instead of per-commit values. When I added a TTL based on_commit_ts, all of those rows were removed right after the TTL was added. If you use these columns for elapsed-time calculations or a TTL, apply them only to rows that arrived through CDC - Adding columns, a TTL, or a projection to a destination table did not stop replication (I was able to add the projection after setting
deduplicate_merge_projection_modetorebuild). If you DROP a destination table, it is recreated empty on the next change to the source table, and the earlier rows are not restored
Replication proceeds in commit order. If there is one large transaction, such as a month-end close, smaller writes behind it have to wait until the large transaction reaches the destination. On a 2 vCPU source, when I inserted 2 million rows in one transaction, rows committed in the meantime took a few minutes to appear in the destination. This is how commit-ordered replication behaves. During large updates, plan for the destination delay to grow.
Operational events: restarts, resizes, and destination stops
With a managed service, source restarts, source resizes, and destination stops happen through user actions or maintenance. I tested each scenario once to see what happens to replication.
| Event | Source | Result |
|---|---|---|
| Restart of the source Postgres | 2 vCPU | WalShadow reconnected about 0.1 seconds after Postgres started. The WalShadow uptime shown in the console did not reset |
| Resizing the source | 2 → 4 → 2 vCPU | Each time the service switched to a new node, WalShadow reconnected to the new node automatically. Not a single latency probe row, inserted every 5 seconds, was lost |
| Stopping and starting the destination service | 16 vCPU | WalShadow resumed on its own about 1 minute after the service started, and the destination row counts matched the source |
| Destination auto-idle | 2 vCPU | Writes on the source woke up the idle destination, and WalShadow caught up without stopping |
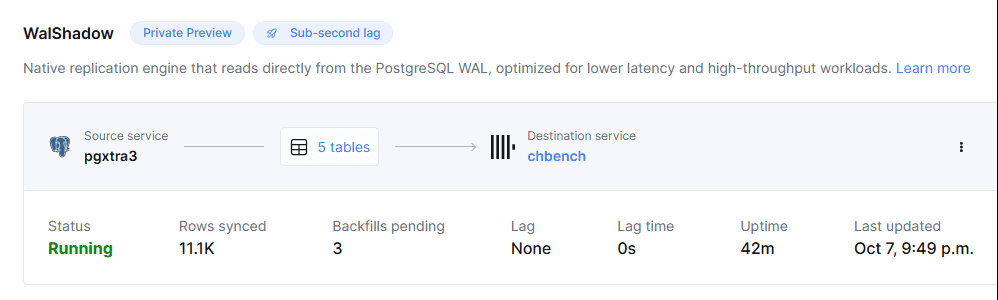 Figure 5: WalShadow after resizing the source from 2 to 4 vCPU. Status remained Running and Uptime did not reset
The default Flush timeout in the wizard is 500 ms. Even with the default, latency stayed under 1 second, and lowering the timeout to 200 ms reduced latency further.
The time from creating WalShadow until replication started was 2 to 7 minutes across 7 setups in October. Between late September and October 1, some setups took about 15 to 20 minutes. From what I observed, the initial load appears to be built from the daily backup plus the subsequent WAL.
One feature request: right now, the only way to know that WalShadow replication has stopped is to check the Status in the console. ClickPipes offers pause and resume as well as a Logs page. It also sent me an email notification when the destination stopped. According to the docs, "operations and more detailed metrics" are on the roadmap3. A similar notification for WalShadow would make it easier to operate.
Issues reported and fixed during the Private Preview
I communicated with the development team through a shared Slack channel. I reported the issues I found along with reproduction steps and timestamps, and when a fix was released, I re-checked it using the same steps. Here are the main issues, in the order the fixes were confirmed.
| What I found | Reported | Fix confirmed | After the fix |
|---|---|---|---|
| Replication stopped after a column type change (int → bigint) | Sep 24 | Sep 25 | Replication continued, and the destination column was widened from Int32 to Int64 automatically. Values beyond the int range were replicated accurately, matching the source |
| After resizing the source (switching to a new node), WalShadow did not reconnect and did not start even when recreated | Sep 24 | Sep 25 (starts when recreated), Oct 7 (reconnects automatically) | Through two resizes, it reconnected without any action from me |
| After stopping and starting the destination manually, WalShadow stayed in an error state and did not recover (according to the team, it had hit the restart limit) | Sep 28 | Oct 2 | It resumed on its own about 1 minute after Start |
| On a table without a primary key (with REPLICA IDENTITY FULL), the initial load collapsed into one row. Old versions of updated rows and deleted rows remained in the destination. When the primary key value was rewritten, the row with the old key remained | Sep 28 | Initial load on Oct 7, the rest on Oct 13 | The initial load had all the rows. The destination table's ORDER BY key now included all columns, and neither old versions nor deleted rows remained. A row with _is_deleted = 1 was written for the old key |
| For a table created after the daily backup, values large enough to be stored in TOAST stopped the initial load | Sep 26 | Oct 16 | The initial load and the changes after it matched the source down to the values |
Fixes arrived within a few days to a few weeks of each report. Some were also published as changes in the open-source walshadow repository, so I was able to see the root cause afterwards. For example, the issue where WalShadow failed to start even when recreated after a resize happened because WalShadow tried to resume from the old timeline, even though the source timeline advances when the source switches to a new node. What I reported made it into the product, and I was able to confirm each fix using the same steps. As a preview participant, I enjoyed the experience.
My impressions
The choice between the two starts with where your Postgres runs.
- ClickPipes is a solid tool for Postgres running outside ClickHouse Managed Postgres, such as on Amazon RDS or Google Cloud SQL1. In this test, it processed about 50,000 rows per second, and the data matched the source. You can tune latency with the Sync interval while the write rate stays within what the pipe can process, and it comes with operational features such as pause and resume and a Logs page
- If your Postgres runs on ClickHouse Managed Postgres, WalShadow is the best option for real-time analytics. Its performance advantage comes from ClickHouse managing both sides of the stack, which allows a native path from the WAL to ClickHouse2. The median latency stayed at about 0.4 seconds at every write rate I tested, so I would not limit it to special low-latency cases
Using WalShadow, I noticed a strong focus on both latency and the user experience. When I opened the dashboard on the ClickHouse side right after writing to Postgres, the data was already there. The moment of "has it shown up yet?" that is so common with analytics replication simply went away, which made WalShadow a pleasant tool to use.
With WalShadow, I was able to build a setup where the application writes only to Postgres and the aggregates on the ClickHouse side update without any extra work. With a delay of about 0.4 seconds, analytics can be part of the application itself, showing what was just written, which makes the application real-time rather than near real-time. The caveats are table selection, how to use the destination tables, and large transactions, all covered in the earlier sections.
Wrapping up
- The WalShadow median latency was about 0.4 seconds at every write rate from 1,000 to 200,000 rows per second. ClickPipes latency followed the Sync interval setting up to about 50,000 rows per second and grew beyond that regardless of the setting or the pipe's compute size. Both methods replicated data that matched the source
- Through application writes, schema changes, source restarts and resizes, and destination stops and auto-idle, replication continued without any manual intervention
- Issues reported during the Private Preview were fixed, and I was able to confirm each fix using the same steps
References
- ClickPipes for Postgres (ClickPipes Postgres CDC docs, including the list of supported sources)
- Introducing WalShadow (ClickHouse blog. How WalShadow reads physical WAL and writes per-table blocks in parallel)
- Sync to ClickHouse with WalShadow (Managed Postgres docs. When to choose WalShadow, and the Private Preview caveats)
- Postgres ClickPipe Sync Control (Defaults for Sync interval and Pull batch size, writing when either is reached, and the recommendation to keep the interval above 10 seconds)
- The team did not share the previous value. Before the change, the median latency was about 1.1 seconds. The development team said they planned to make 200 ms the new default. Later, in early October, the wizard started letting users set Flush timeout themselves (default 500 ms; see the section on operational events)
- walshadow: Limitations (Open-source documentation. Changes to different tables in one transaction may become visible in ClickHouse at different moments)
Get started with ClickHouse Managed Postgres today
Interested in seeing how ClickHouse Managed Postgres works on your data? Get started with ClickHouse Cloud in minutes and receive $300 in free credits.
Sign up