The ClickHouse monitoring dashboard
Mark Needham, Product Marketing Engineer
Learn how to diagnose three common ClickHouse issues using the built-in monitoring dashboard. This tutorial covers how to detect small batch sizes, resource-intensive queries, and suboptimal primary key design using ClickHouse's advanced monitoring features.
You'll learn how to:
- Set up and access the monitoring dashboard
- Monitor batch insertions and part merging behavior
- Identify CPU-intensive query patterns
- Detect inefficient primary key designs through bytes-read metrics
Perfect for ClickHouse administrators and developers who want to improve their system monitoring skills. Includes practical examples using ClickHouse Cloud.
Recent videos
View all Videos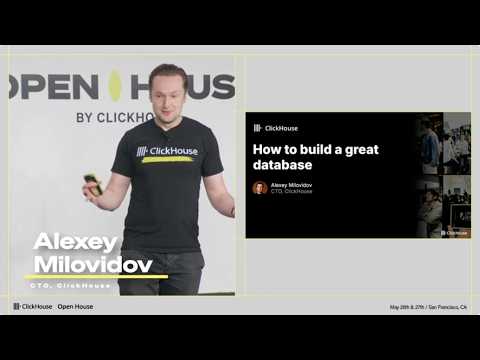
Open House, ClickHouse
How to build a great database (Alexey Milovidov)
The principles behind building a great database, and the new frontiers shaping the field.
Open House, ClickHouse
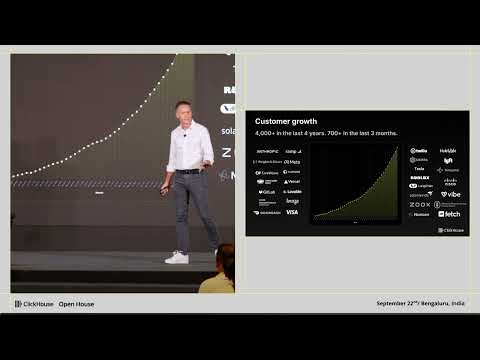
The real-time data platform for AI
Ed Lenta, VP, Asia Pacific & Japan at ClickHouse, sets the stage for the day: ClickHouse as the real-time data platform for AI.
Open House, ClickHouse
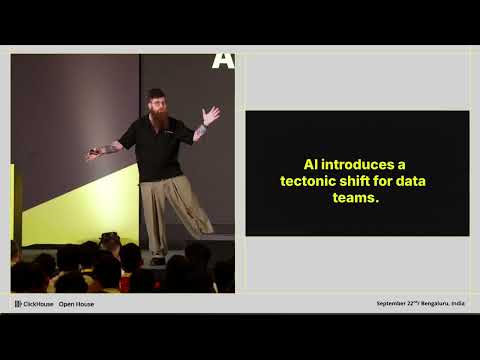
Keynote: Building real-time data and AI at scale
Krithika Balagurunathan, Sr Director, Product Management, and Tyler Hannan, Senior Director, Developer Advocacy at ClickHouse, walk through building real-time data and AI systems at scale on ClickHouse.
Open House, ClickHouse
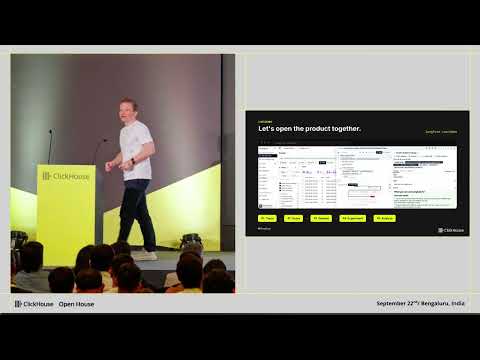
Shipping reliable AI agents with Langfuse and ClickHouse
Max Deichmann, CTO & Co-Founder at Langfuse, shows how to build and ship reliable AI agents with Langfuse and ClickHouse.
Follow us


