前置条件
- 一个 Kubernetes 集群 (建议使用 v1.20+) ,其中至少有一个节点可为 ClickHouse 提供 32 GiB 的 RAM 和 100GB 的可用磁盘空间。
- Helm v3+
kubectl,并已配置为与你的集群交互
部署选项
-
开源 ClickStack:将 ClickStack 完全部署在 Kubernetes 集群内,包括:
- ClickHouse
- HyperDX
- MongoDB (用于存储仪表板状态和配置)
- 托管 ClickStack:ClickHouse 和 ClickStack UI (HyperDX) 由 ClickHouse Cloud 托管,因此无需在集群内运行 ClickHouse 或 HyperDX。
1
安装 cert-manager (可选)
如果你的环境需要 TLS 证书,请使用 Helm 安装 cert-manager:
2
部署 OpenTelemetry Demo (可选)
此步骤为可选项,仅适用于当前没有可监控 pod (容器组) 的情况。如果你已在 Kubernetes 环境中部署了现有服务,可以跳过此步骤;不过,此 Demo 确实包含已埋点的微服务,它们会生成 trace 和会话回放数据,便于你体验 ClickStack 的全部功能。以下内容将在 Kubernetes 集群中部署 ClickStack 的 OpenTelemetry Demo 应用栈分支版本,专门用于可观测性测试和埋点展示。其中包括后端微服务、负载生成器、遥测管道、配套基础设施 (如 Kafka、Redis) ,以及与 ClickStack 的 SDK 集成。所有服务都会部署到 完成演示环境部署后,确认所有 Pod (容器组) 均已成功创建并处于 该演示由使用不同编程语言编写的微服务组成,这些微服务通过 gRPC 和 HTTP 相互通信,此外还有一个使用 Locust 模拟用户流量的负载生成器。此演示的原始源代码已修改为使用 ClickStack 插桩。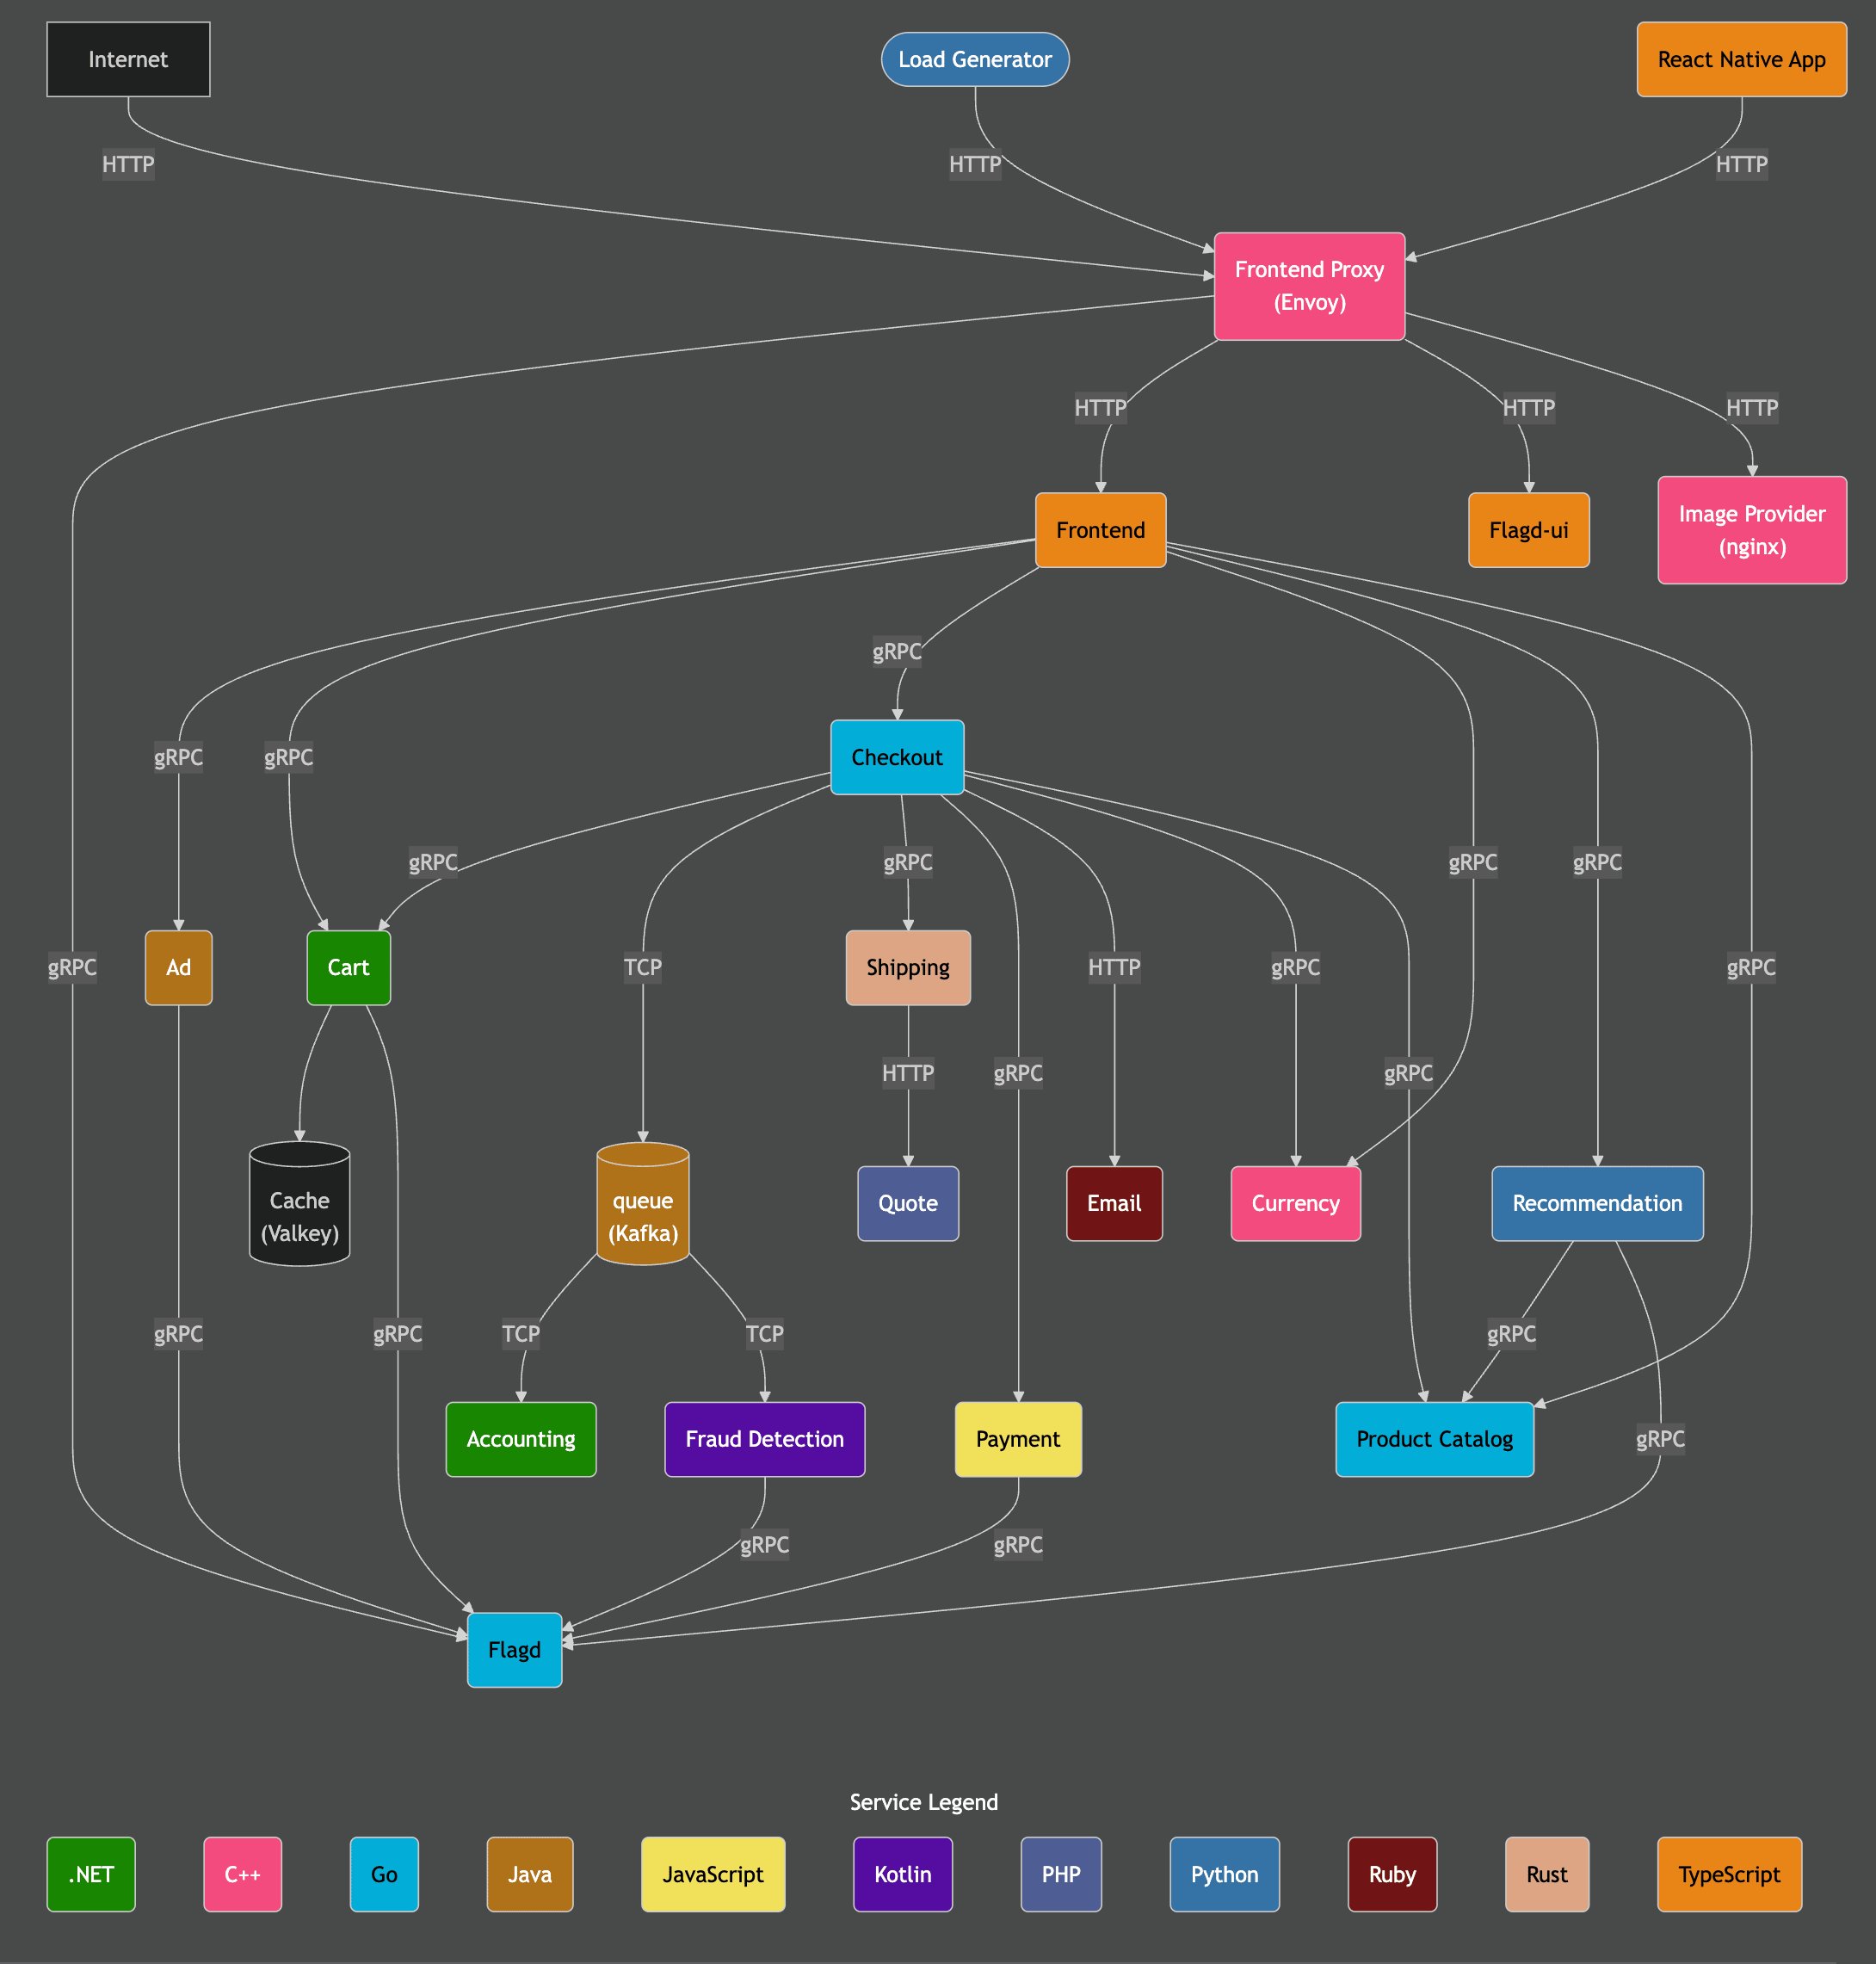
otel-demo 命名空间。每个部署包括:- 使用 OTel 和 ClickStack SDKS 对链路追踪、指标和日志进行自动埋点。
- 所有服务都会将其埋点数据发送到
my-hyperdx-hdx-oss-v2-otel-collectorOpenTelemetry collector (未部署) - 通过环境变量
OTEL_RESOURCE_ATTRIBUTES转发资源标签,以关联日志、指标和链路追踪。
Running 状态:演示架构
3
添加 ClickStack Helm 图表仓库
4
部署 ClickStack
安装 Helm 图表后,您可以将 ClickStack 部署到集群中。您可以选择在 Kubernetes 环境中运行包括 ClickHouse 和 HyperDX 在内的全部组件,也可以仅部署 collector,并将 ClickHouse 和 HyperDX UI 交由托管 ClickStack 提供。
要验证部署状态,请运行以下命令,并确认所有组件都处于
ClickStack 开源版(自管理)
ClickStack 开源版(自管理)
以下命令会将 ClickStack 安装到 如果您未部署 OTel demo,也可以修改此值并选择合适的命名空间。
otel-demo 命名空间中。helm 图表会部署:- 一个 ClickHouse 实例
- HyperDX
- ClickStack 版 OTel collector
- 用于存储 HyperDX 应用状态的 MongoDB
您可能需要根据 Kubernetes 集群配置调整
storageClassName。托管 ClickStack
托管 ClickStack
如果您更倾向于使用托管 ClickStack,可以部署 ClickStack 并禁用随附的 ClickHouse。
该图表当前始终会同时部署 HyperDX 和 MongoDB。虽然这些组件提供了另一种访问途径,但它们尚未与 ClickHouse Cloud 的身份验证集成。在这种部署模式下,这些组件主要供管理员使用,用于获取安全摄取密钥,以便通过已部署的 OTel collector 进行摄取,但不应向终端用户开放。
Running 状态。请注意,如果您使用的是托管 ClickStack,则不会看到 ClickHouse:5
访问 HyperDX UI
即使使用托管 ClickStack,仍然仍需要 Kubernetes 集群中部署的本地 HyperDX 实例。它会提供由 HyperDX 内置的 OpAMP server 管理的摄取密钥,并通过已部署的 OTel collector 实现安全摄取——而托管 ClickStack 目前尚不具备这一能力。
ClusterIP,默认不会对外暴露。要访问 HyperDX UI,请将服务的 3000 端口转发到本地 8080 端口。6
获取摄取 API key
由 ClickStack collector 部署的 OTel collector 使用摄取密钥来保护摄取过程。前往
Team Settings,然后在 API Keys 部分复制 Ingestion API Key。此 API key 可确保通过 OpenTelemetry collector 进行的数据摄取安全无虞。7
创建 API key Kubernetes Secret
创建一个新的 Kubernetes Secret,其中包含摄取 API key,以及一个 config map,用于保存通过 ClickStack Helm 图表部署的 OTel collector 的位置。后续组件将使用这些信息,以便将数据摄取到通过 ClickStack Helm 图表部署的 collector 中:重新启动 OpenTelemetry Demo Application 的 Pod (容器组) ,以使摄取 API key 生效。来自演示服务的 trace 和日志数据现在应该已开始流入 HyperDX。
8
添加 OpenTelemetry Helm 仓库
为了收集 Kubernetes 指标,我们将部署一个标准的 OTel collector,并将其配置为使用上述摄取 API key,将数据安全地发送到我们的 ClickStack collector。这需要先安装 OpenTelemetry Helm 仓库:
9
部署 Kubernetes collector 组件
要从集群本身及各节点收集日志和指标,需要部署两个独立的 OpenTelemetry 采集器,每个采集器对应各自的清单。提供的两个清单——
接下来,将 collector 部署为 DaemonSet 守护进程集,以采集节点和 pod (容器组) 级别的指标与日志:
k8s_deployment.yaml 和 k8s_daemonset.yaml——协同工作,从 Kubernetes 集群中采集完整的遥测数据。-
k8s_deployment.yaml用于部署一个单个 OpenTelemetry Collector 实例,负责收集整个集群范围内的事件和元数据。它会收集 Kubernetes 事件、集群指标,并使用 pod 标记和注解来丰富遥测数据。该收集器以单副本的独立部署方式运行,以避免产生重复数据。 -
k8s_daemonset.yaml部署了一个基于 DaemonSet 守护进程集的采集器,会在集群中的每个节点上运行。它使用kubeletstats、hostmetrics和 Kubernetes attribute processors 等组件收集节点级和 pod (容器组) 级指标以及容器日志。这些采集器会为日志补充元数据,并通过 OTLP 导出器将其发送到 HyperDX。
k8s_deployment.yaml
k8s_deployment.yaml
k8s_daemonset.yaml
k8s_daemonset.yaml
10
在 HyperDX 中探索 Kubernetes 数据
前往您的 HyperDX UI——无论是通过部署在 Kubernetes 中的实例,还是通过托管 ClickStack。
要查看 Kubernetes 数据,请前往位于
托管 ClickStack
托管 ClickStack
如果使用托管 ClickStack,只需登录您的 ClickHouse Cloud 服务,然后从左侧菜单中选择 “ClickStack”。系统会自动完成身份验证,您无需创建用户。日志、指标和链路追踪的数据源也会预先为您创建好。
ClickStack 开源版
ClickStack 开源版
要访问本地部署的 HyperDX,您可以使用本地命令进行端口转发,然后通过 http://localhost:8080 访问 HyperDX。
生产环境中的 ClickStack在生产环境中,如果您不使用托管 ClickStack,我们建议使用启用 TLS 的入口。例如:
/kubernetes 的专用预置仪表板,例如 http://localhost:8080/kubernetes。Pods、Nodes 和 Namespaces 这些标签页中都应显示数据。