将 Zing Data 连接到 ClickHouse
Zing Data 是一个数据探索与可视化平台。Zing Data 使用 ClickHouse 提供的 JS 驱动程序连接到 ClickHouse。
如何连接
- 收集你的连接信息。
要通过 HTTP(S) 连接到 ClickHouse,您需要以下信息:
| 参数 | 说明 |
|---|---|
HOST 和 PORT | 通常,在使用 TLS 时端口为 8443,不使用 TLS 时端口为 8123。 |
DATABASE NAME | 默认提供一个名为 default 的数据库,请填写您要连接的目标数据库名称。 |
USERNAME 和 PASSWORD | 默认用户名为 default。请使用适合您使用场景的用户名。 |
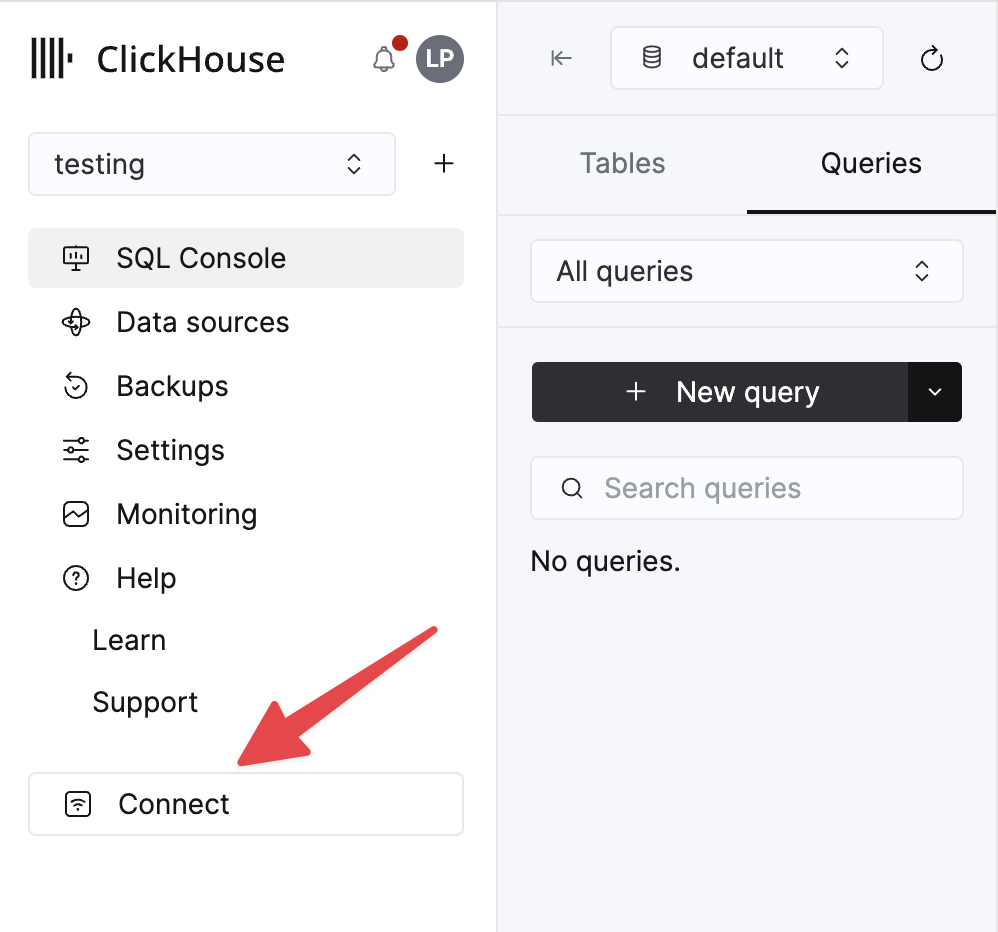
您的 ClickHouse Cloud 服务的详细信息可以在 ClickHouse Cloud 控制台中查看。 选择某个服务并点击 Connect:
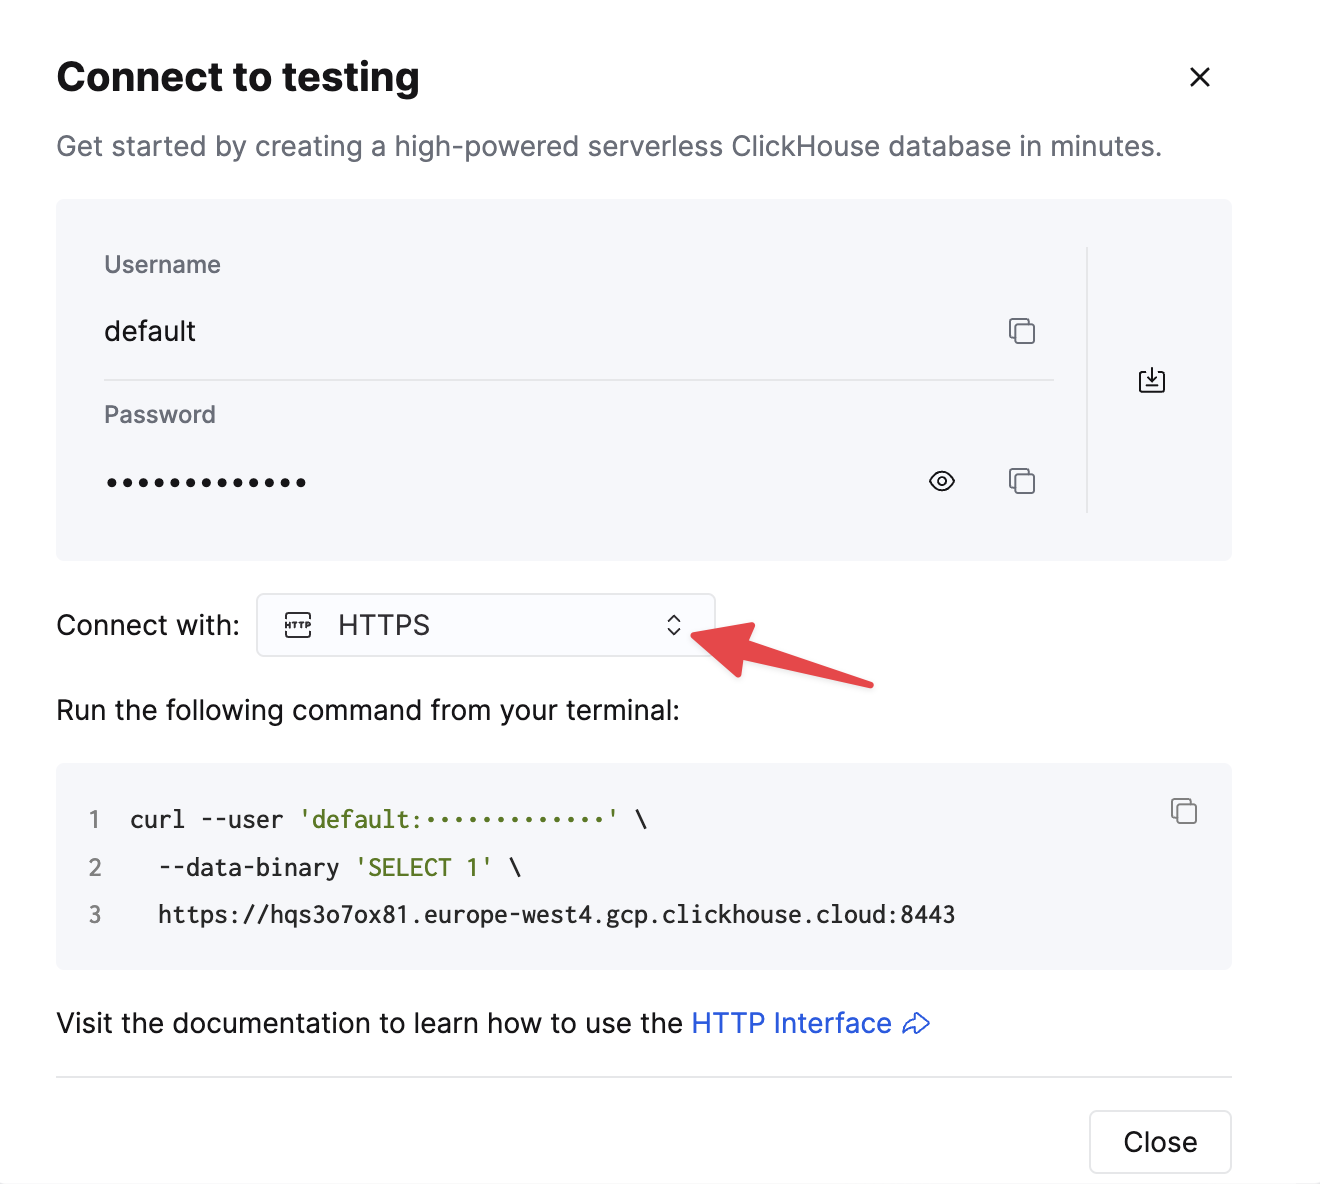
选择 HTTPS。连接信息会显示在示例 curl 命令中。
如果您使用的是自托管 ClickHouse,则连接信息由您的 ClickHouse 管理员进行设置。
-
下载或访问 Zing Data
-
要在移动端将 ClickHouse 与 Zing Data 一起使用,请在 Google Play Store 或 Apple App Store 下载 Zing Data 应用。
-
要在 Web 端将 ClickHouse 与 Zing Data 一起使用,请访问 Zing web console 并创建账号。
-
-
添加一个数据源
-
要在 Zing Data 中操作你的 ClickHouse 数据,你需要定义一个 datasource(数据源)。在 Zing Data 移动应用的菜单中选择 Sources,然后点击 Add a Datasource。
-
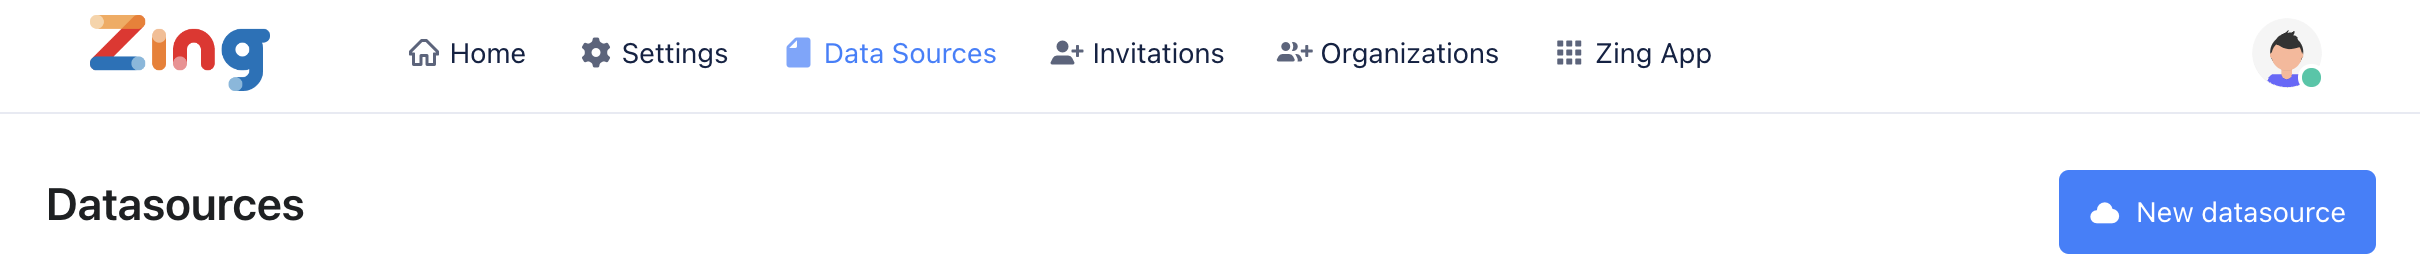
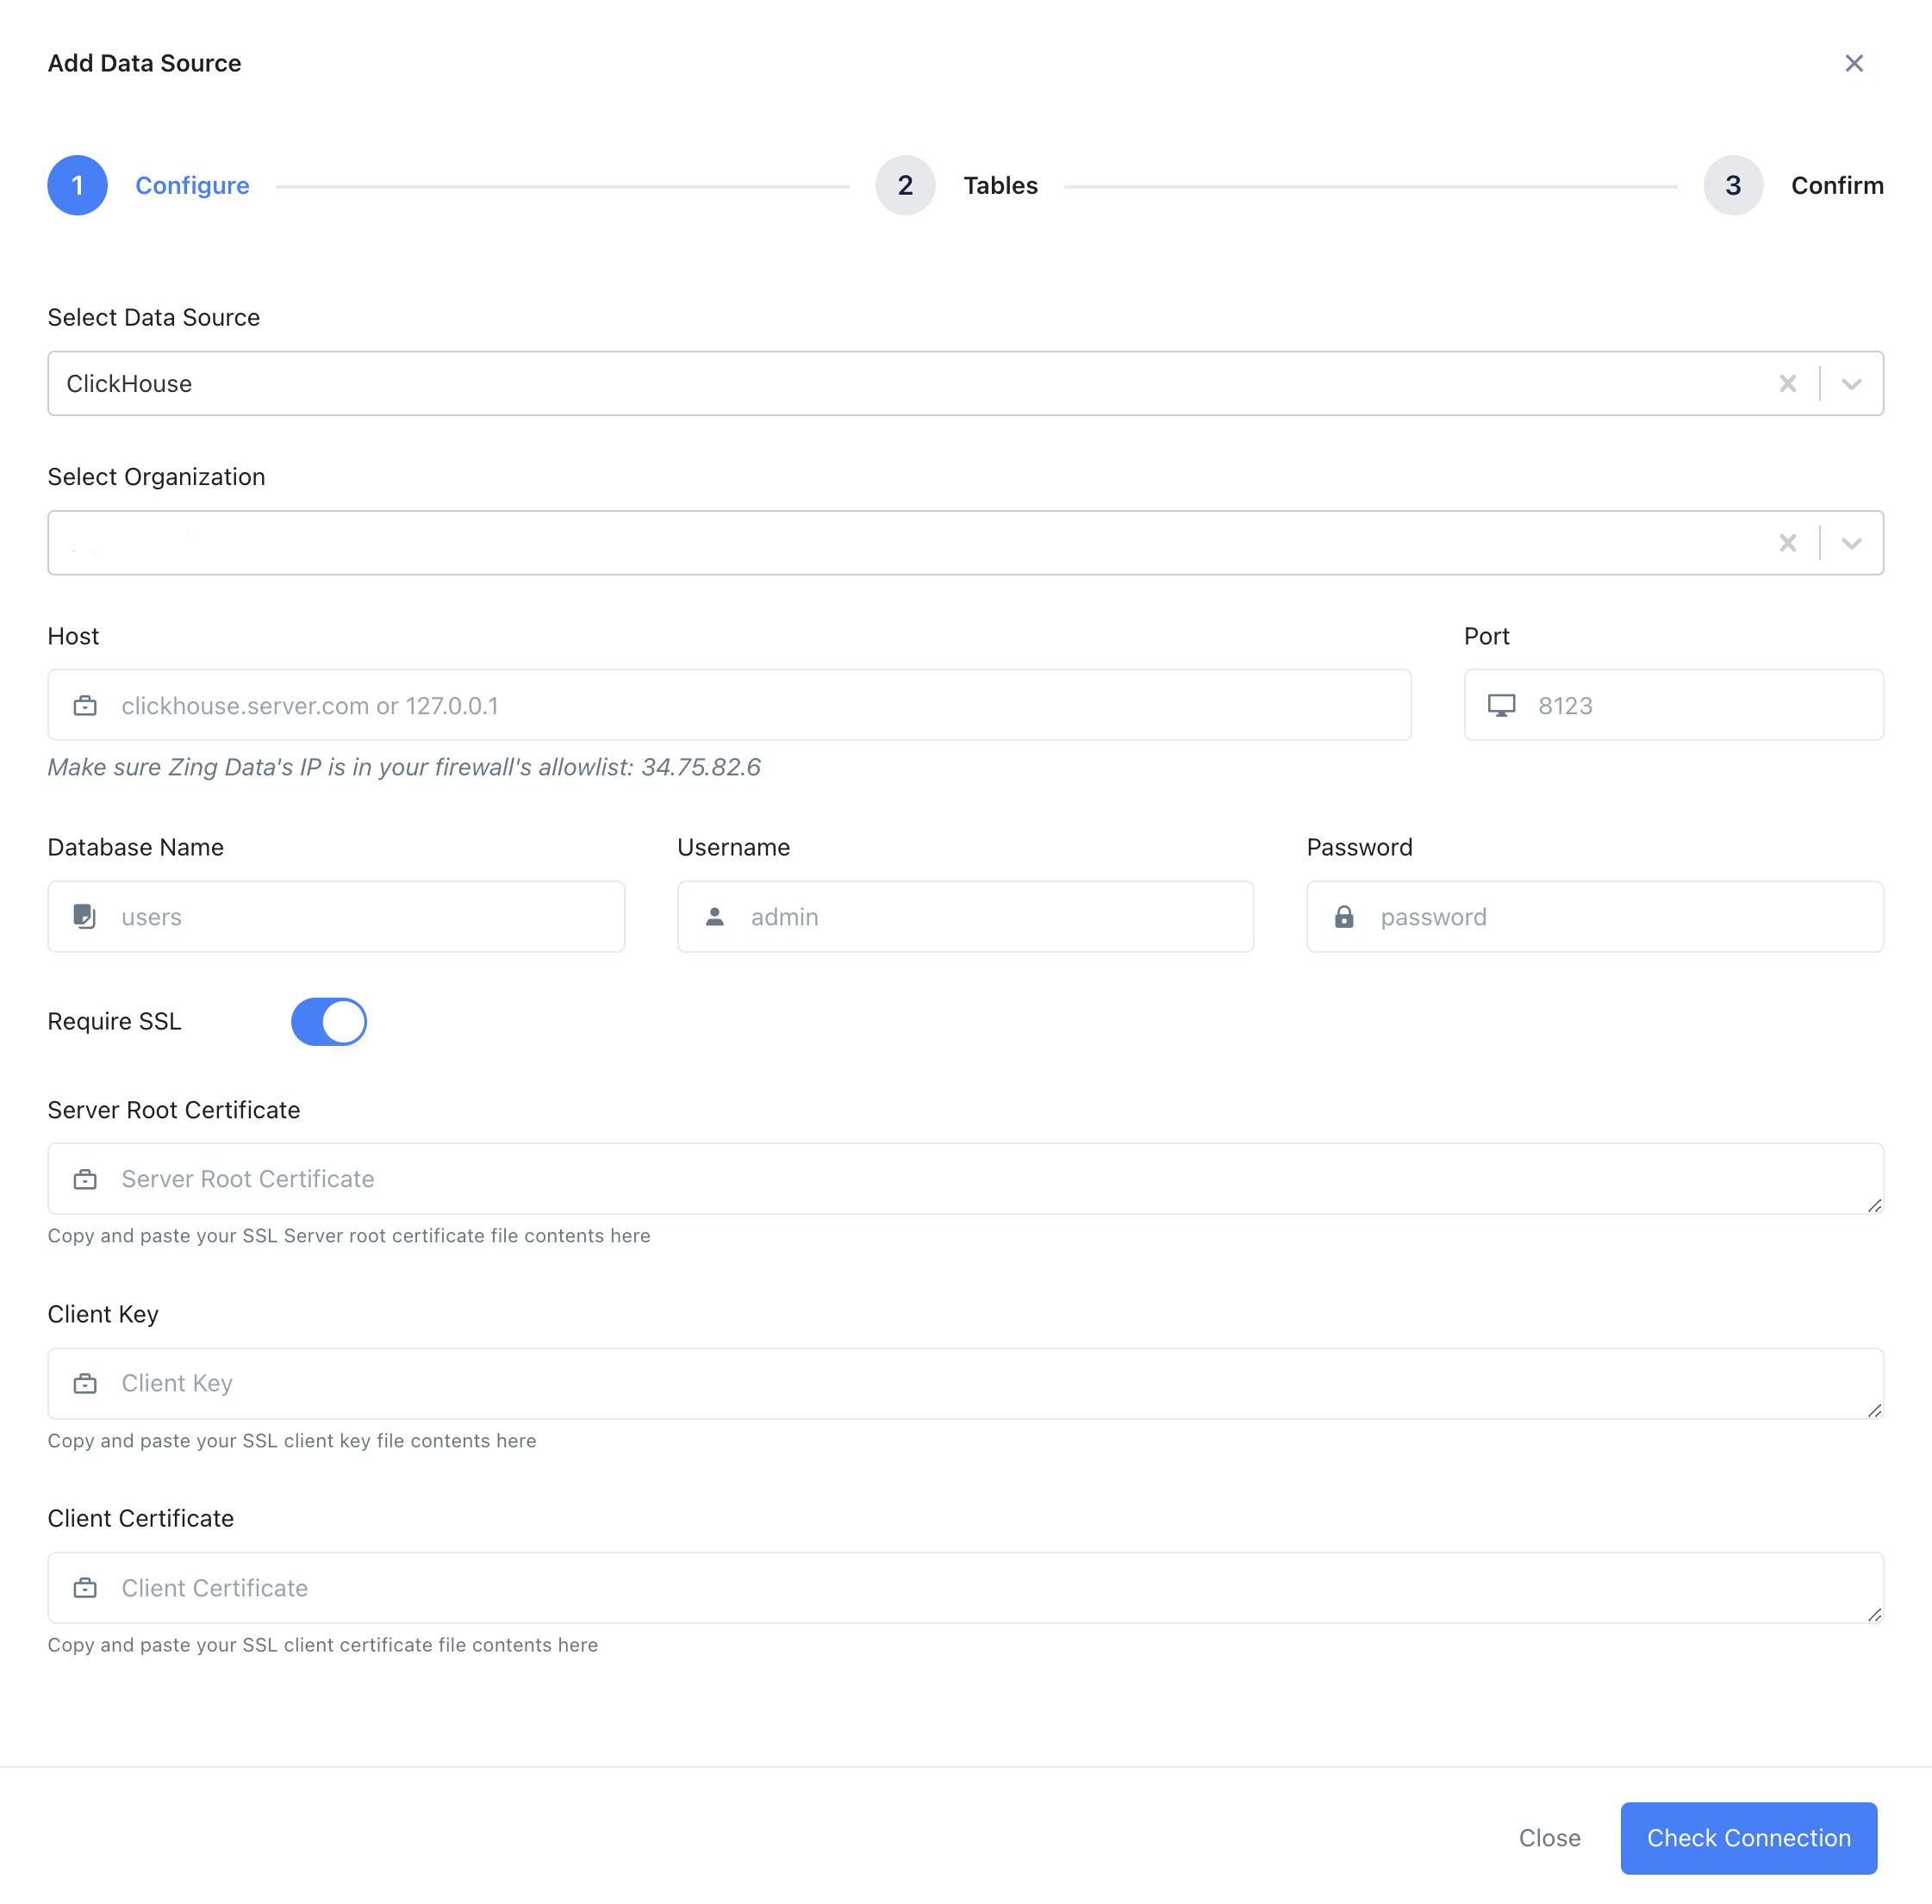
要在 Web 端添加数据源,点击顶部菜单中的 Data Sources,再点击 New Datasource,并在下拉菜单中选择 ClickHouse。
-
-
填写连接信息,然后点击 Check Connection。
-
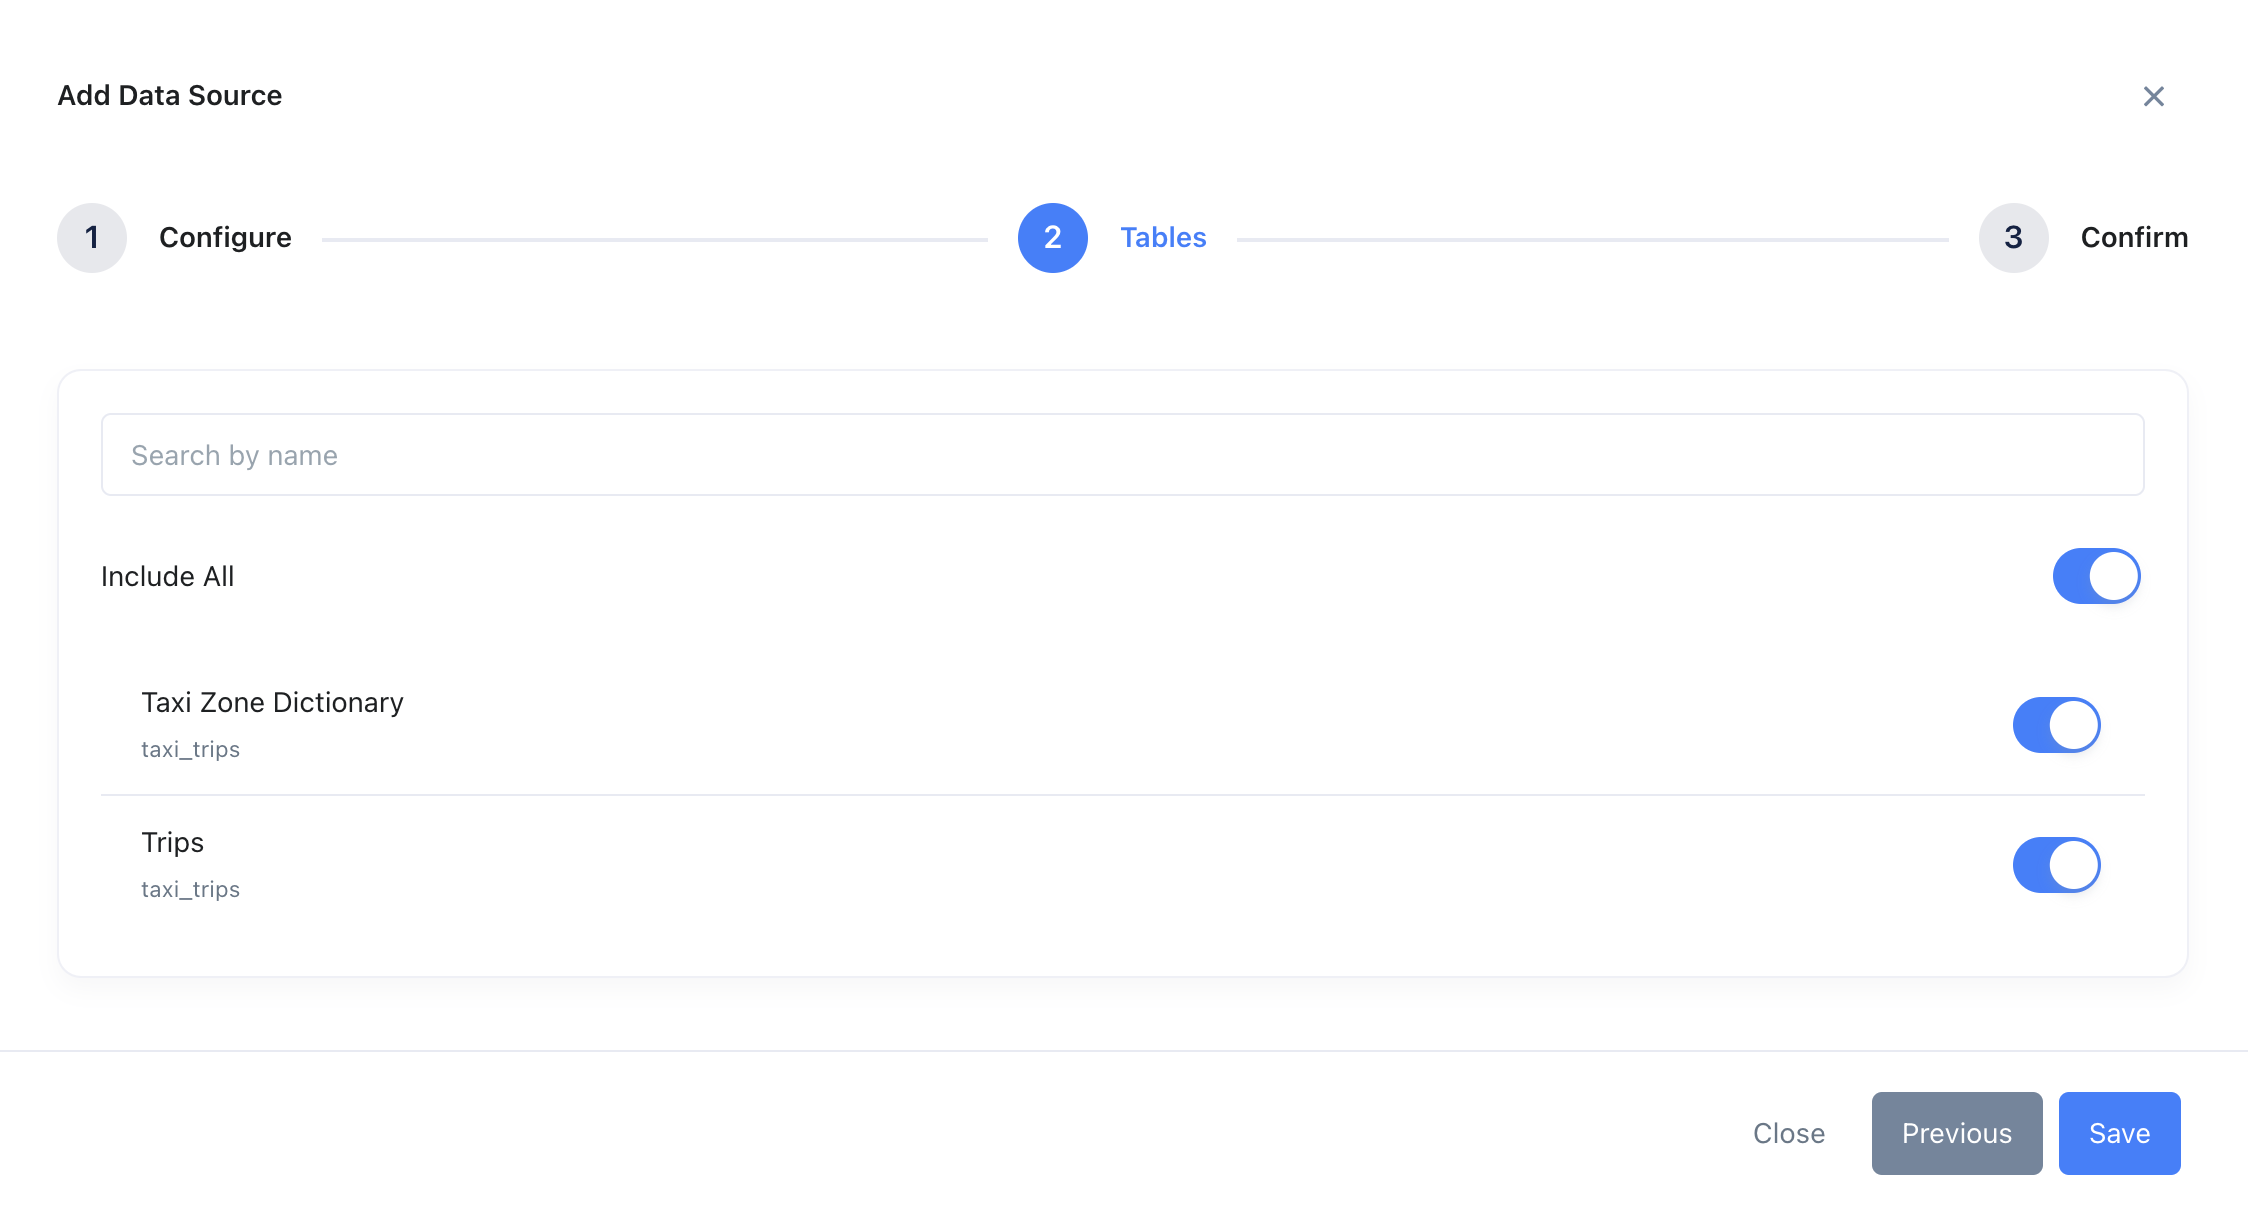
如果连接成功,Zing 会进入数据表选择界面。选择所需的数据表并点击 Save。如果 Zing 无法连接到你的数据源,你会看到一条消息,提示你检查凭据并重试。如果在检查凭据并重试后仍然遇到问题,请通过此处联系 Zing 支持。
-
一旦添加了 ClickHouse 数据源,你的 Zing 组织中的所有人都可以在 Data Sources / Sources 选项卡下访问它。
在 Zing Data 中创建图表和仪表板
-
添加 ClickHouse 数据源后,在 Web 端点击 Zing App,或在移动端点击该数据源开始创建图表。
-
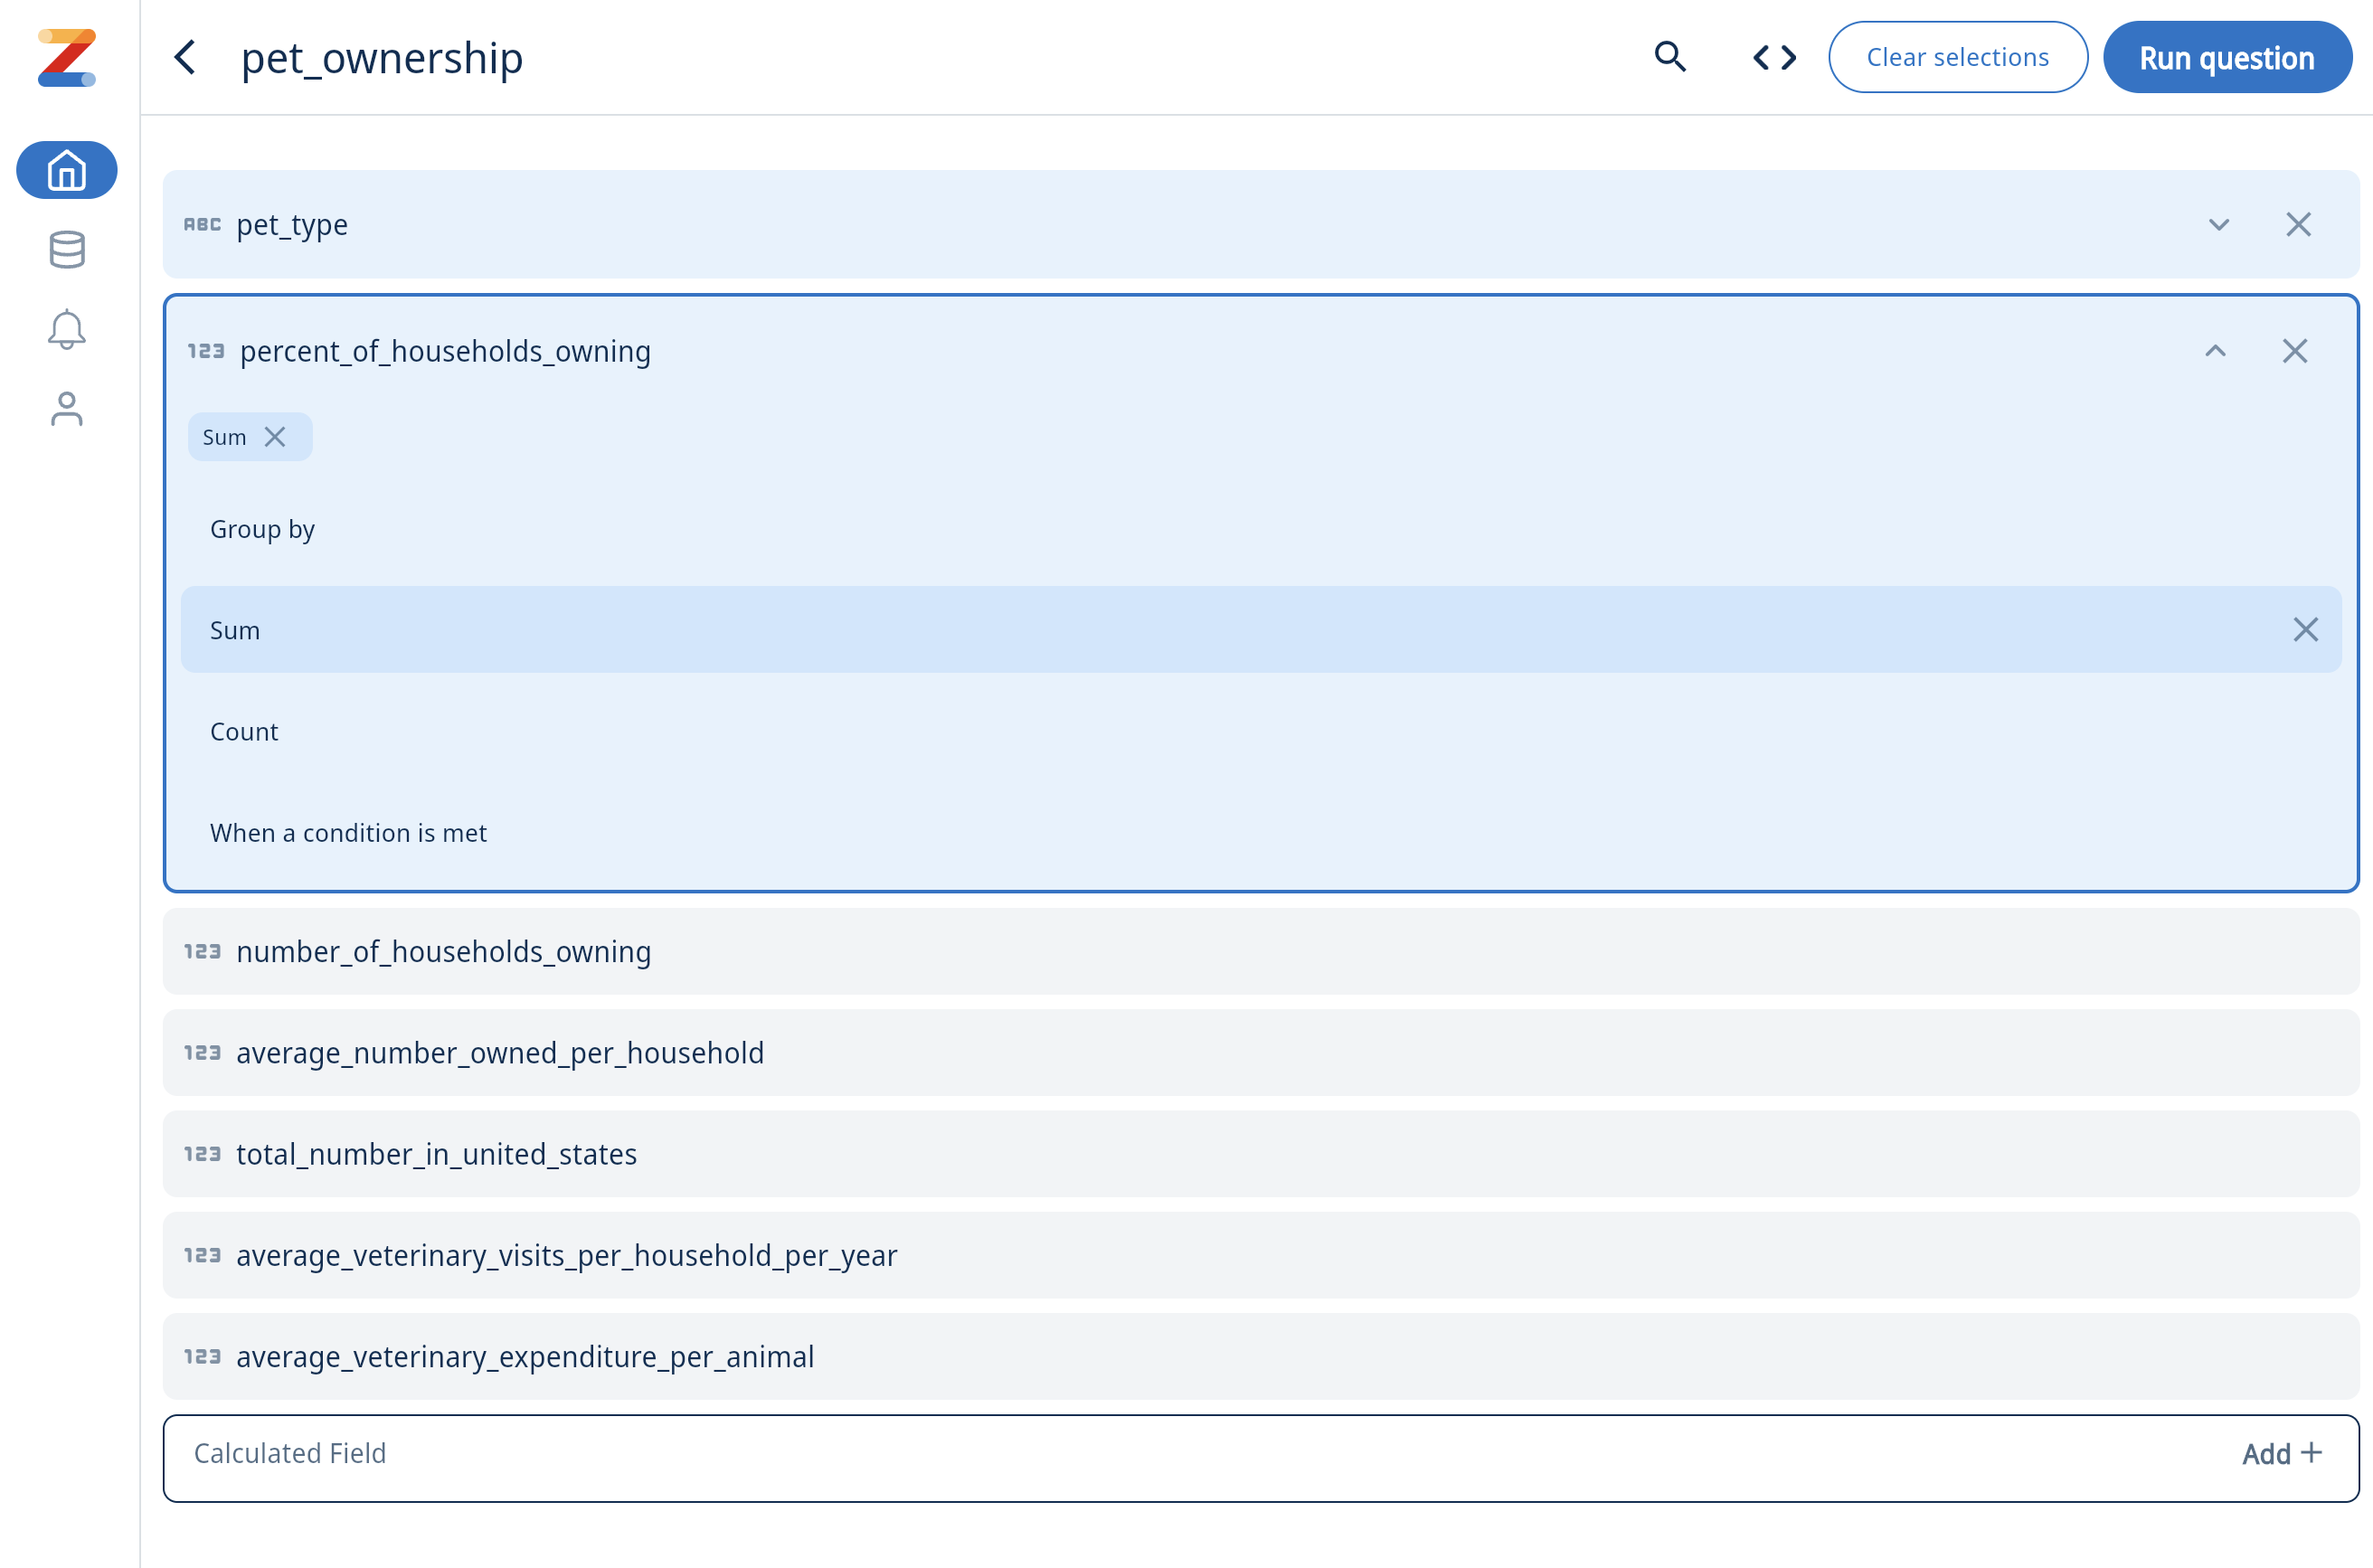
在表列表中点击某个表来创建图表。

-
使用可视化查询构建器选择所需字段、聚合等,然后点击 Run Question。
-
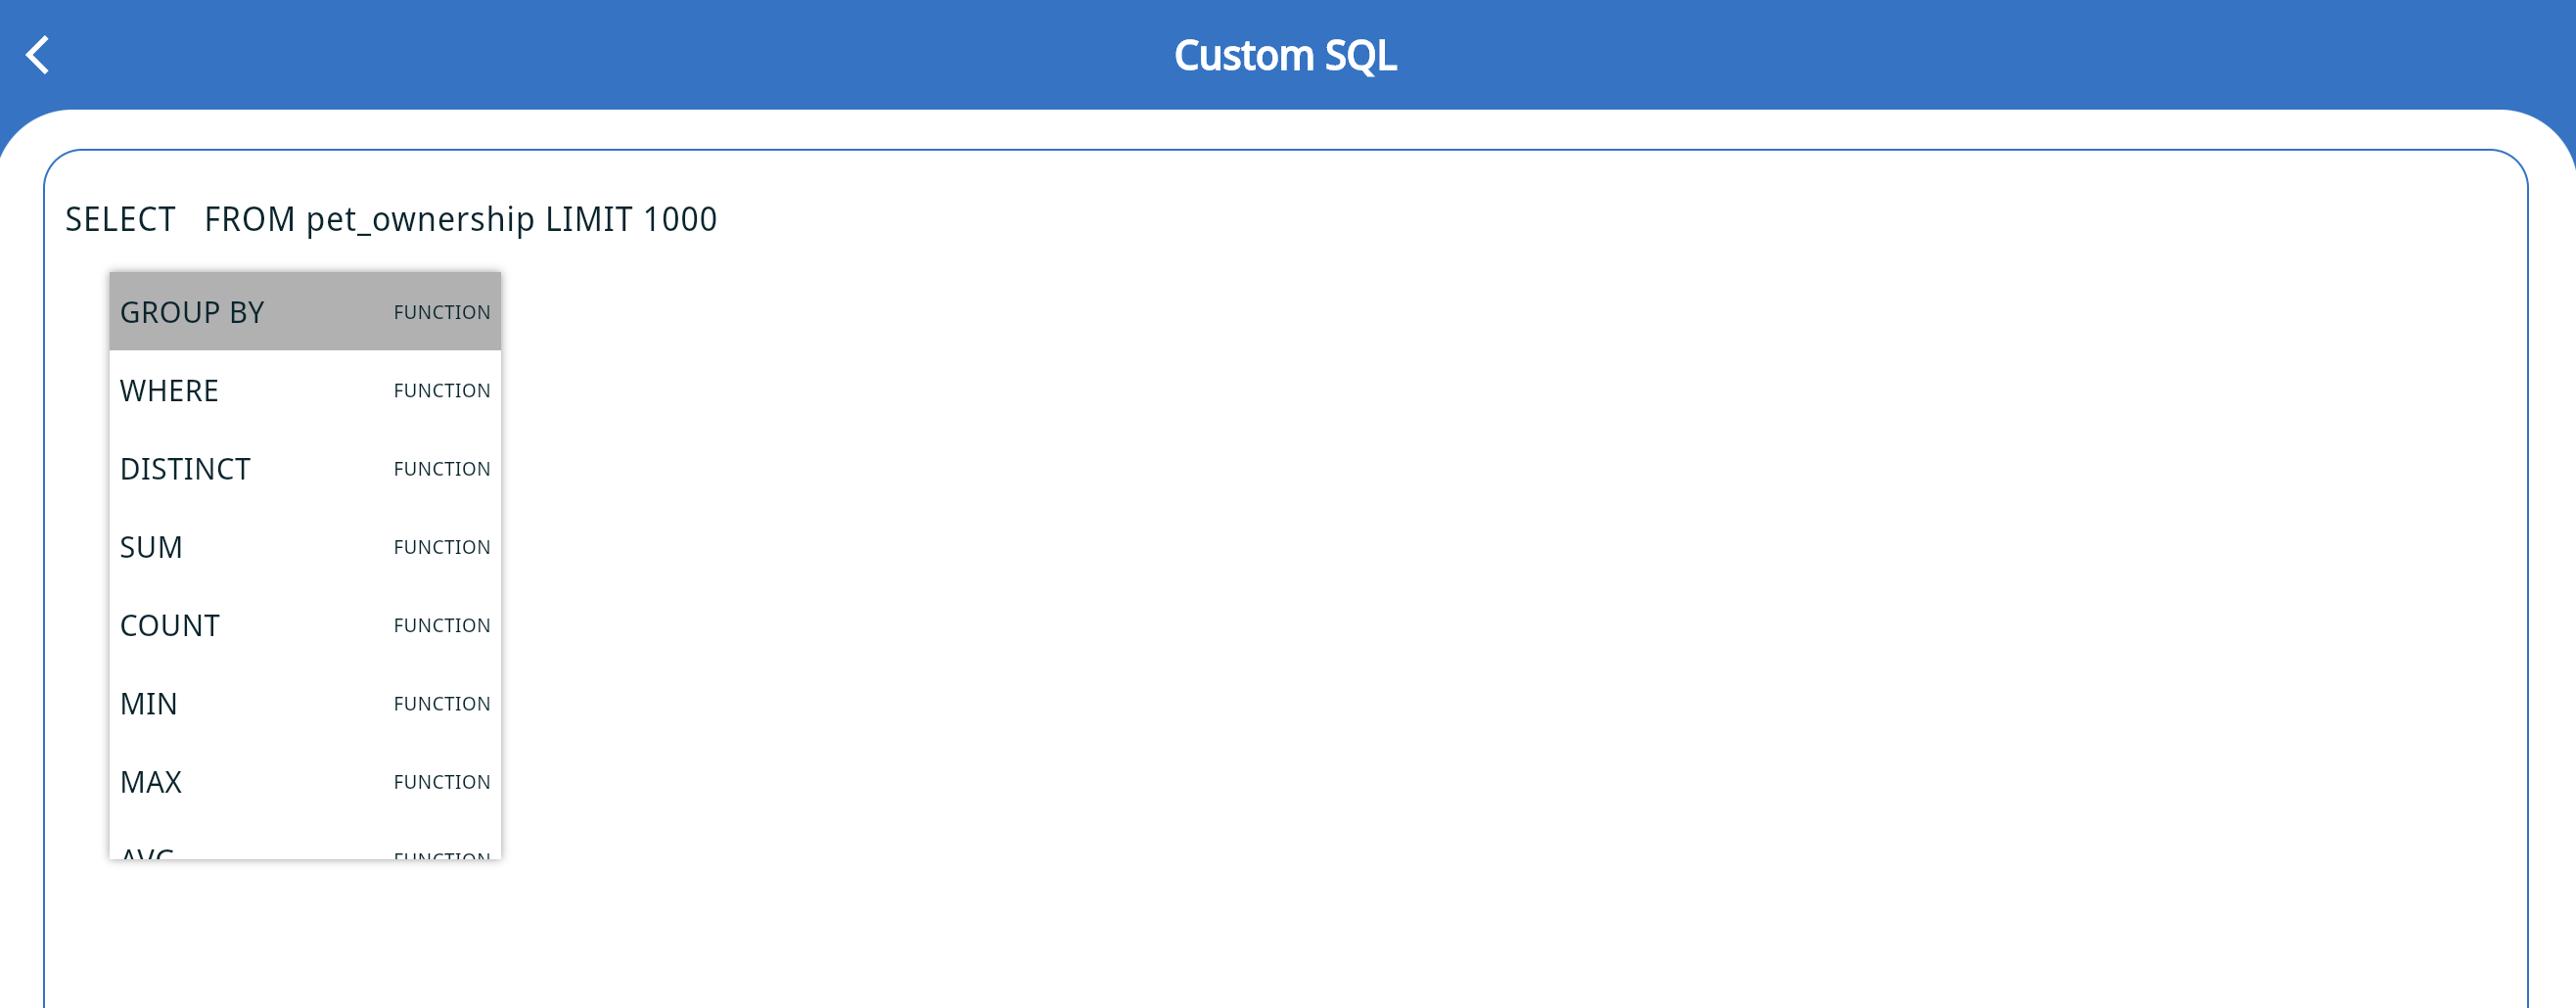
如果熟悉 SQL,也可以编写自定义 SQL 来运行查询并创建图表。

-
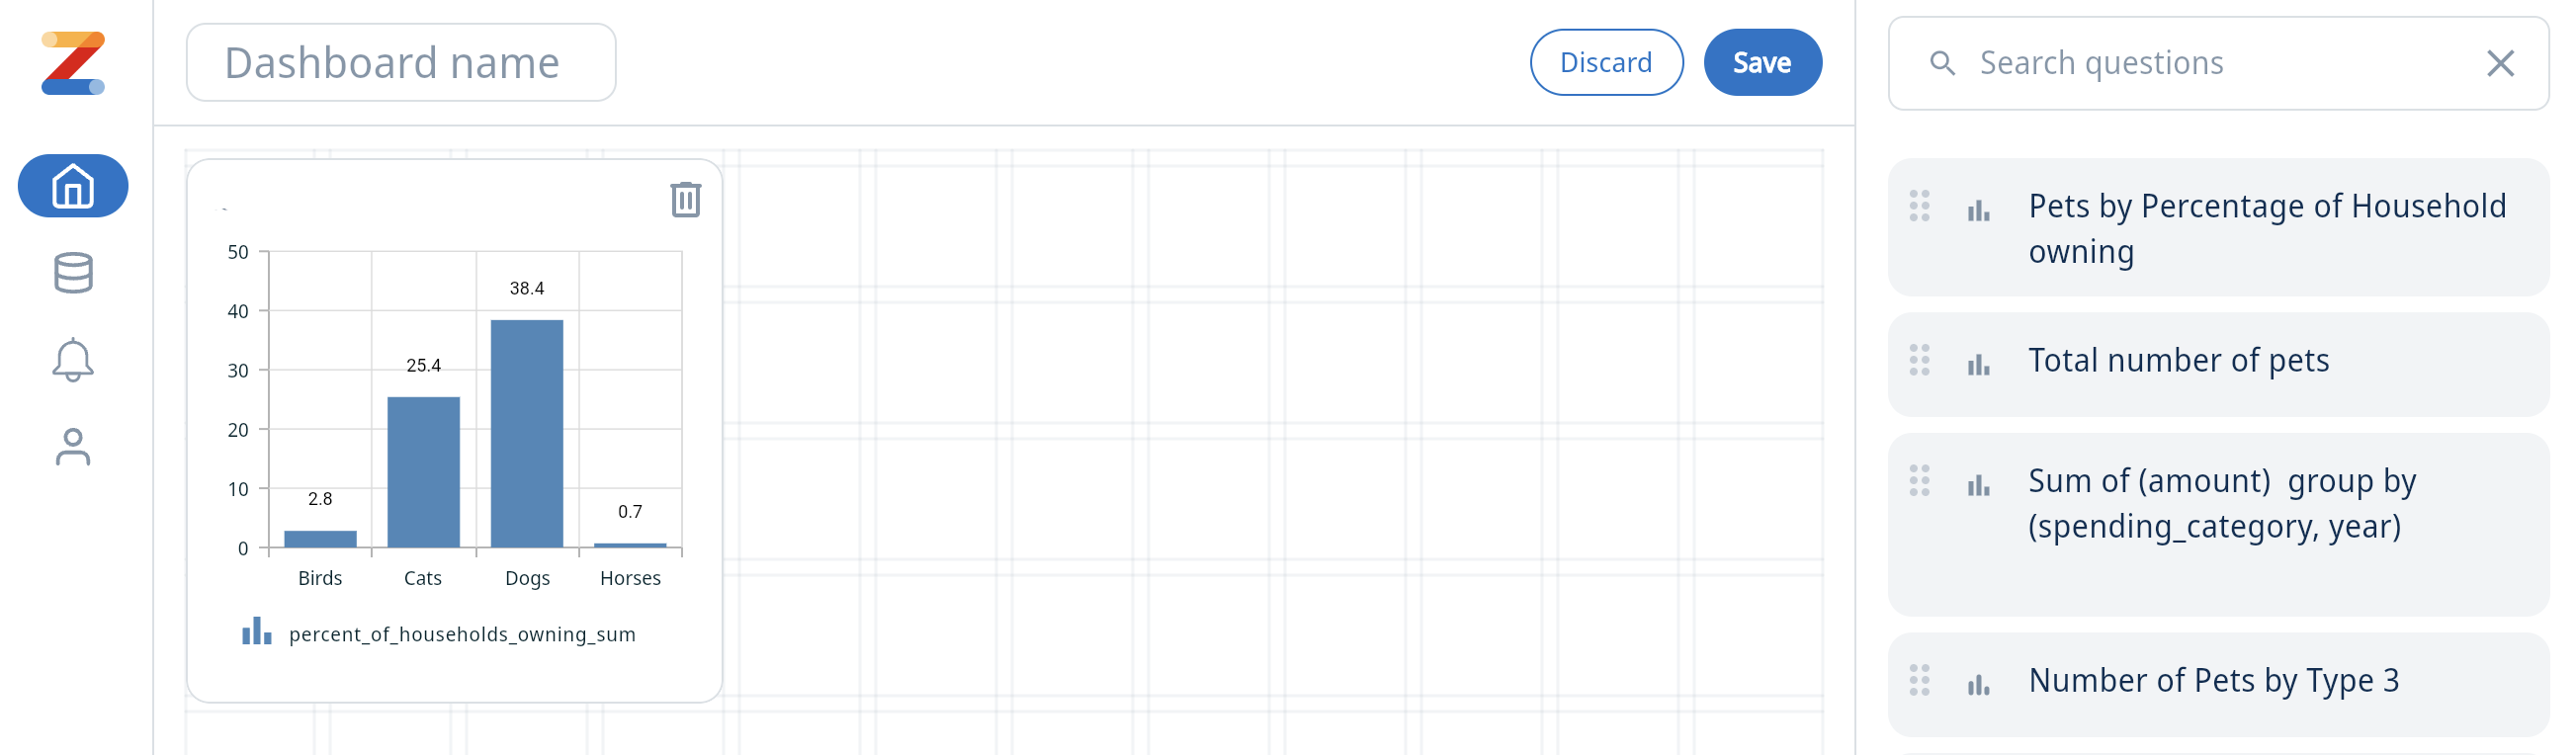
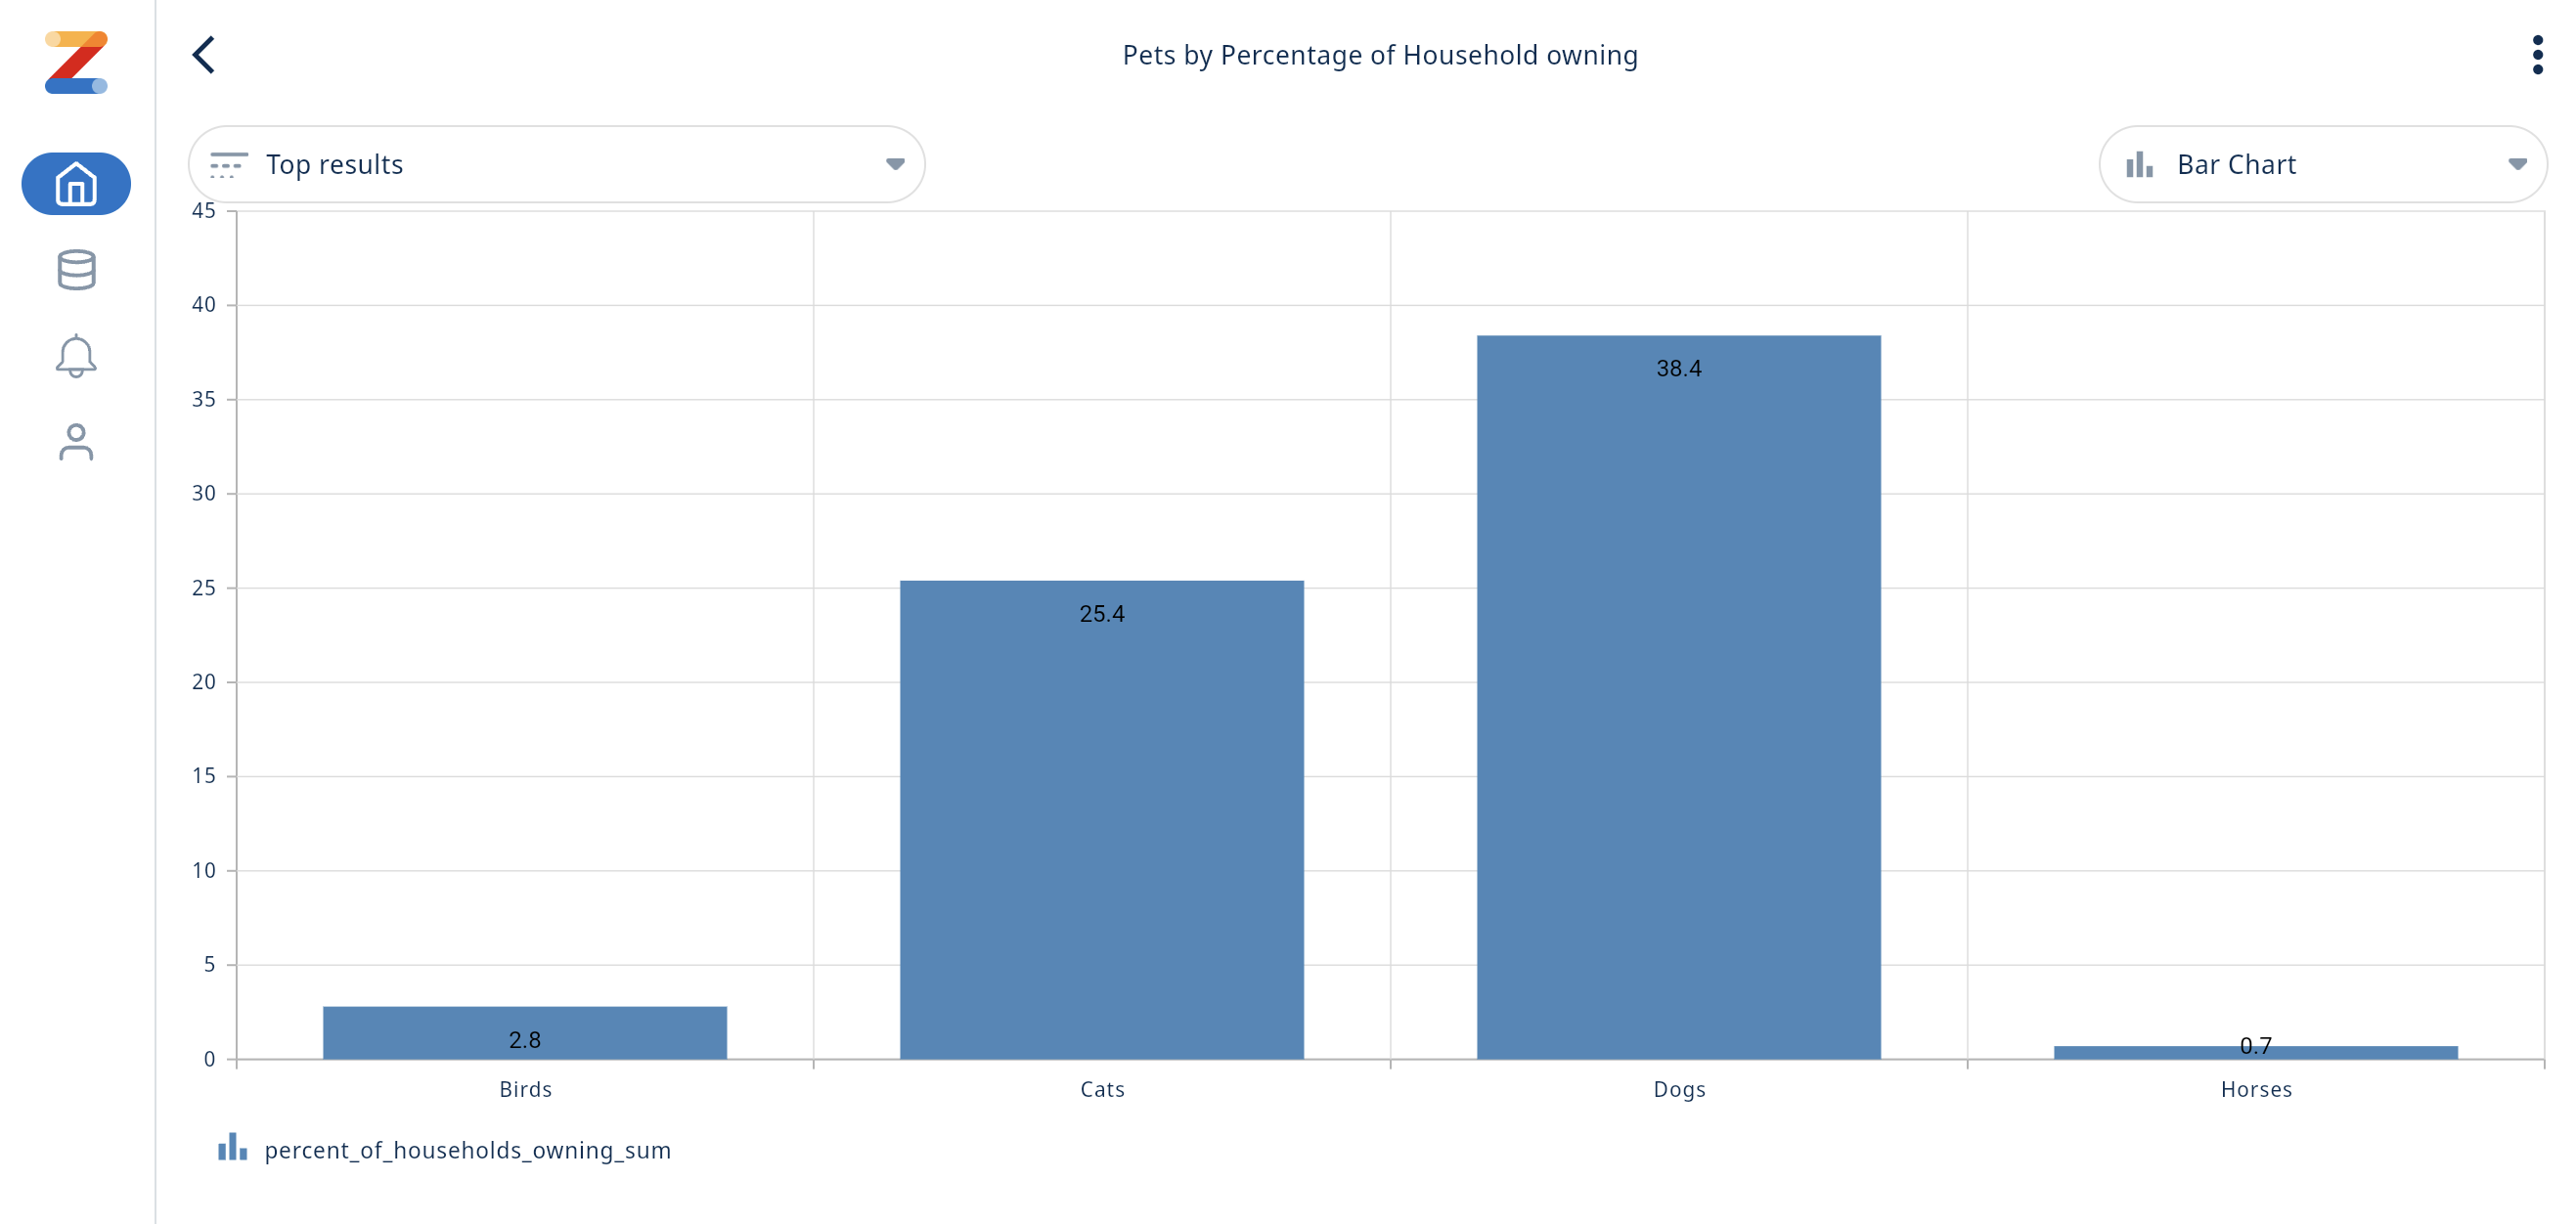
一个示例图表如下所示。可以通过右上角的三点菜单保存该问题。还可以对图表发表评论、@ 标签团队成员、创建实时告警、更改图表类型等。
-
可以在主页的 Dashboards 下通过点击 “+” 图标来创建仪表板。可以将已有的问题拖入其中,以在仪表板上展示。