> ## Documentation Index
> Fetch the complete documentation index at: https://clickhouse.com/docs/llms.txt
> Use this file to discover all available pages before exploring further.

> Tableau 可将 ClickHouse 数据库和表作为数据源使用。

# 将 Tableau 连接到 ClickHouse

export const ClickHouseSupportedBadge = () => {
  return <div className="ClickHouseSupportedBadge">
            <div className="ClickHouseSupportedIcon">
                <svg width="16" height="16" viewBox="0 0 16 16" fill="none" xmlns="http://www.w3.org/2000/svg">
                    <path d="M1.30762 1.39073C1.30762 1.3103 1.37465 1.22986 1.46849 1.22986H2.64824C2.72868 1.22986 2.80912 1.29689 2.80912 1.39073V14.4886C2.80912 14.5691 2.74209 14.6495 2.64824 14.6495H1.46849C1.38805 14.6495 1.30762 14.5825 1.30762 14.4886V1.39073Z" fill="currentColor" />
                    <path d="M4.2832 1.39073C4.2832 1.3103 4.35023 1.22986 4.44408 1.22986H5.62383C5.70427 1.22986 5.7847 1.29689 5.7847 1.39073V14.4886C5.7847 14.5691 5.71767 14.6495 5.62383 14.6495H4.44408C4.36364 14.6495 4.2832 14.5825 4.2832 14.4886V1.39073Z" fill="currentColor" />
                    <path d="M7.25977 1.39073C7.25977 1.3103 7.3268 1.22986 7.42064 1.22986H8.60039C8.68083 1.22986 8.76127 1.29689 8.76127 1.39073V14.4886C8.76127 14.5691 8.69423 14.6495 8.60039 14.6495H7.42064C7.3402 14.6495 7.25977 14.5825 7.25977 14.4886V1.39073Z" fill="currentColor" />
                    <path d="M10.2354 1.39073C10.2354 1.3103 10.3024 1.22986 10.3962 1.22986H11.576C11.6564 1.22986 11.7369 1.29689 11.7369 1.39073V14.4886C11.7369 14.5691 11.6698 14.6495 11.576 14.6495H10.3962C10.3158 14.6495 10.2354 14.5825 10.2354 14.4886V1.39073Z" fill="currentColor" />
                    <path d="M13.2256 6.6057C13.2256 6.52526 13.2926 6.44482 13.3865 6.44482H14.5662C14.6466 6.44482 14.7271 6.51186 14.7271 6.6057V9.27354C14.7271 9.35398 14.6601 9.43442 14.5662 9.43442H13.3865C13.306 9.43442 13.2256 9.36739 13.2256 9.27354V6.6057Z" fill="currentColor" />
                </svg>
            </div>
            支持 ClickHouse
        </div>;
};

export const Image = ({img, alt, size = "lg"}) => {
  const normalizedSize = ["sm", "md", "lg"].includes(size) ? size : "lg";
  return <div className={`ch-image-${normalizedSize}`}>
      <Frame>
        <img src={img} alt={alt} />
      </Frame>
    </div>;
};

<ClickHouseSupportedBadge />

ClickHouse 提供官方 Tableau 连接器，并已在
[Tableau Exchange](https://exchange.tableau.com/products/1064) 上架。
该连接器基于 ClickHouse 的高级 [JDBC 驱动](/docs/zh/integrations/language-clients/java/jdbc)。

借助此连接器，Tableau 可将 ClickHouse 数据库和表作为数据源进行集成。要启用此功能，
请按照下方的设置指南进行操作。

<div id="setup-required-prior-usage">
  ## 使用前的准备工作
</div>

1. 准备好连接详细信息

   要通过 HTTP(S) 连接到 ClickHouse，你需要以下信息：

   | Parameter(s)                                           | Description                                |
   | ------------------------------------------------------ | ------------------------------------------ |
   | `HOST` and `PORT`                                      | 通常，使用 TLS 时端口为 8443；不使用 TLS 时端口为 8123。     |
   | `DATABASE NAME`                                        | 默认情况下，存在一个名为 `default` 的数据库。请使用你要连接的数据库名称。 |
   | `USERNAME` and `PASSWORD`                              | 默认情况下，用户名为 `default`。请根据你的使用场景使用相应的用户名。    |
   | 你的 ClickHouse Cloud 服务的连接信息可在 ClickHouse Cloud 控制台中查看。 |                                            |
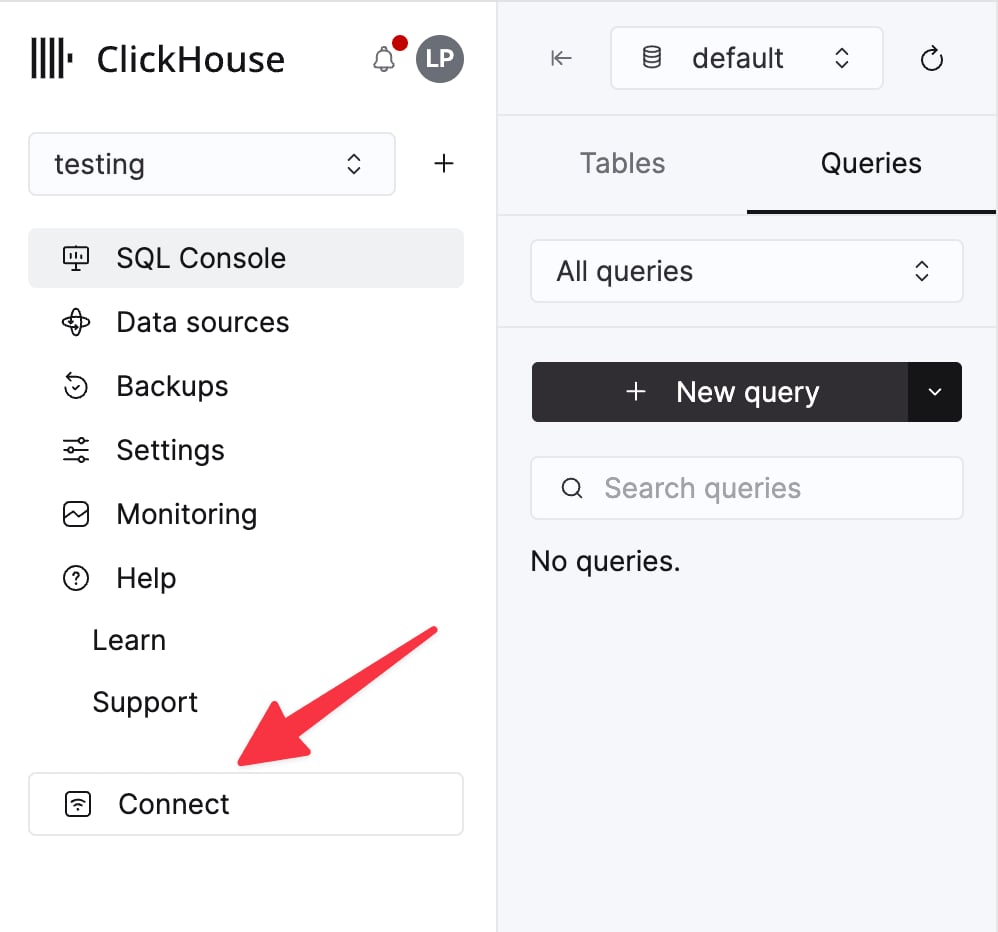
   | 选择一个服务，然后点击 **Connect**：                               |                                            |

   <div className="ch-image-md">
     <Frame>
       <img src="https://mintcdn.com/private-7c7dfe99/CFFsa2agBPbviR4r/images/_snippets/cloud-connect-button.webp?fit=max&auto=format&n=CFFsa2agBPbviR4r&q=85&s=ec0a298a33ca841e947fa5e8bae47362" alt="ClickHouse Cloud 服务连接按钮" width="998" height="932" data-path="images/_snippets/cloud-connect-button.webp" />
     </Frame>
   </div>

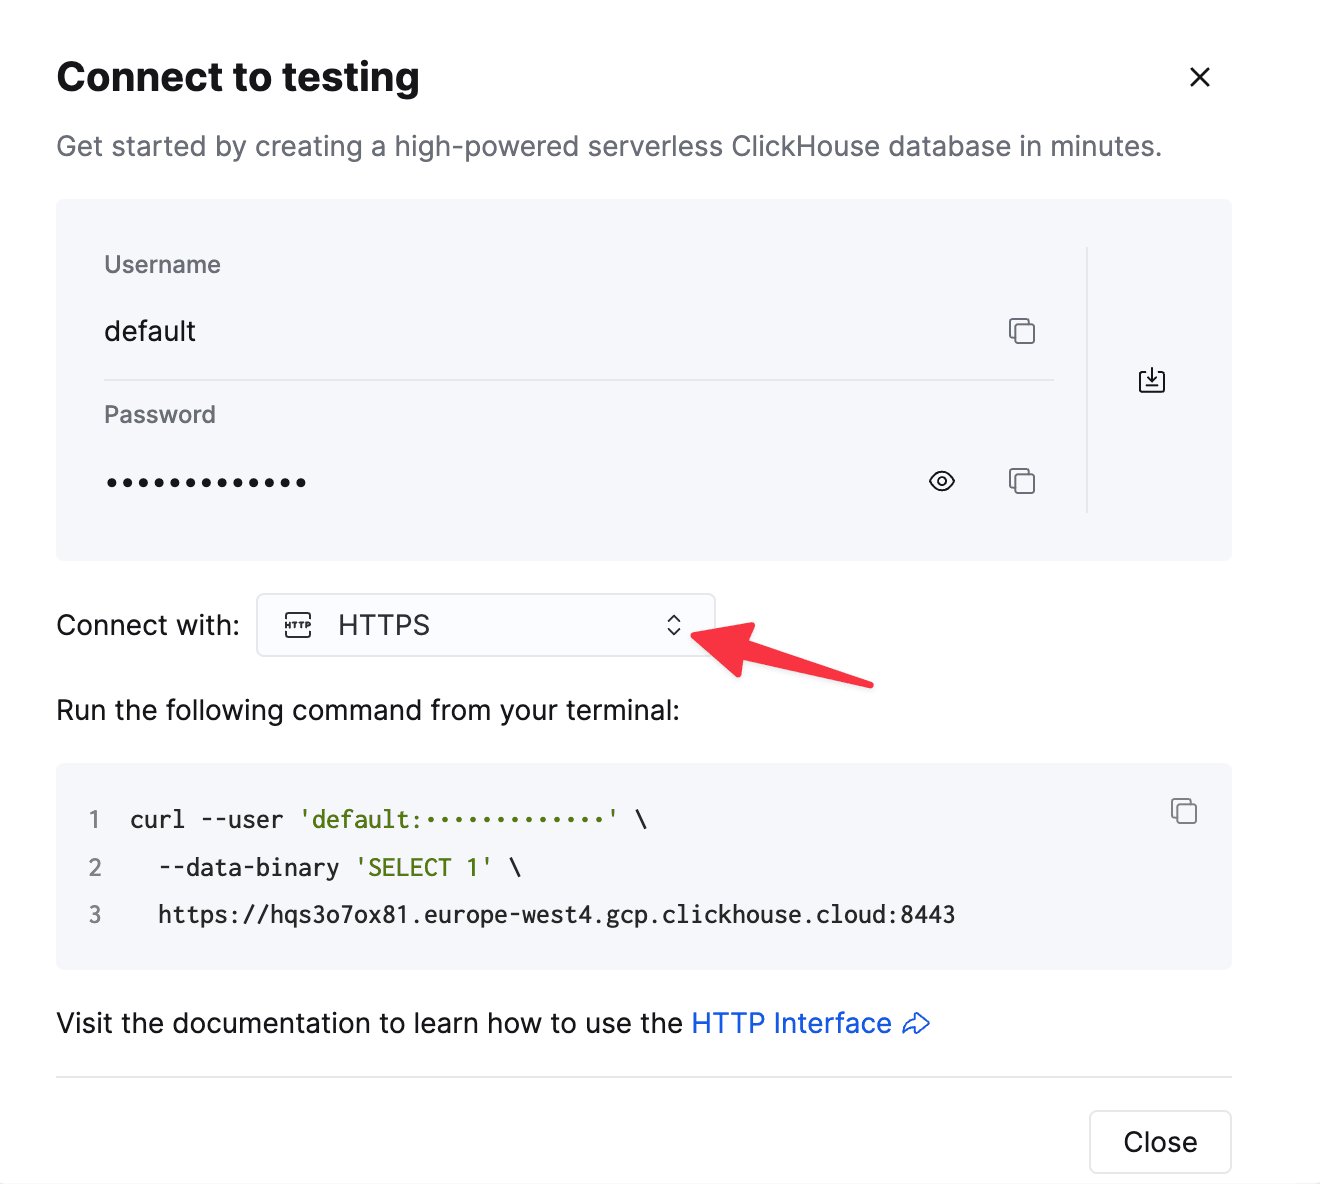
   选择 **HTTPS**。连接信息会显示在示例 `curl` 命令中。

   <div className="ch-image-md">
     <Frame>
       <img src="https://mintcdn.com/private-7c7dfe99/CFFsa2agBPbviR4r/images/_snippets/connection-details-https.webp?fit=max&auto=format&n=CFFsa2agBPbviR4r&q=85&s=cb0fbd98aa2b5b7ca484c9f53395ee07" alt="ClickHouse Cloud HTTPS 连接信息" width="1320" height="1184" data-path="images/_snippets/connection-details-https.webp" />
     </Frame>
   </div>

   如果你使用的是自管理 ClickHouse，则连接信息由你的 ClickHouse 管理员配置。

2. 下载并安装 <a href="https://www.tableau.com/products/desktop/download" target="_blank">Tableau
   Desktop</a>。

3. 按照 `clickhouse-tableau-connector-jdbc` 的说明，下载兼容版本的
   <a href="https://github.com/ClickHouse/clickhouse-java/releases/" target="_blank">ClickHouse JDBC 驱动</a>。

<Note>
  请确保下载 [clickhouse-jdbc-X.X.X-all-dependencies.jar](https://github.com/ClickHouse/clickhouse-java/releases) JAR 文件。该制品自版本 `0.9.2` 起提供。
</Note>

4. 将 JDBC 驱动放到以下文件夹中 (根据操作系统选择；如果文件夹不存在，可以自行创建) ：
   * macOS: `~/Library/Tableau/Drivers`
   * Windows: `C:\Program Files\Tableau\Drivers`
5. 在 Tableau 中配置 ClickHouse 数据源，然后开始构建数据可视化！

<div id="configure-a-clickhouse-data-source-in-tableau">
  ## 在 Tableau 中配置 ClickHouse 数据源
</div>

现在你已经安装并配置好了 `clickhouse-jdbc` 驱动，接下来看看如何在 Tableau 中定义一个数据源，以连接到 ClickHouse 中的 **TPCD** 数据库。

1. 启动 Tableau。 (如果它已经在运行，请先重启。)

2. 在左侧菜单中，点击 **To a Server** 部分下的 **More**。在可用连接器列表中搜索 **ClickHouse by ClickHouse**：

<Image size="md" img="https://mintcdn.com/private-7c7dfe99/etDiFo_9fGSe5rMN/images/integrations/data-visualization/tableau_connecttoserver.webp?fit=max&auto=format&n=etDiFo_9fGSe5rMN&q=85&s=7ab3febdaa3274ab6c0b04773ddb5b38" alt="显示连接器选择菜单且高亮 ClickHouse by ClickHouse 选项的 Tableau 连接界面" border width="980" height="697" data-path="images/integrations/data-visualization/tableau_connecttoserver.webp" />

<br />

<Note>
  在连接器列表中看不到 **ClickHouse by ClickHouse** 连接器？这可能与 Tableau Desktop 版本过旧有关。
  要解决这个问题，可以考虑升级 Tableau Desktop，或者[手动安装该连接器](#install-the-connector-manually)。
</Note>

3. 点击 **ClickHouse by ClickHouse**，随后会弹出以下对话框：

<Image size="md" img="https://mintcdn.com/private-7c7dfe99/etDiFo_9fGSe5rMN/images/integrations/data-visualization/tableau_connector_details.webp?fit=max&auto=format&n=etDiFo_9fGSe5rMN&q=85&s=0472da4a01606db99c8a49ebdd52cd5d" alt="显示 ClickHouse JDBC 连接器详细信息和安装按钮的 Tableau 连接器安装对话框" border width="746" height="636" data-path="images/integrations/data-visualization/tableau_connector_details.webp" />

<br />

4. 点击 **Install and Restart Tableau**。重启应用程序。
5. 重启后，该连接器将显示其完整名称：`ClickHouse JDBC by ClickHouse, Inc.`。点击它后，会弹出以下对话框：

<Image size="md" img="https://mintcdn.com/private-7c7dfe99/etDiFo_9fGSe5rMN/images/integrations/data-visualization/tableau_connector_dialog.webp?fit=max&auto=format&n=etDiFo_9fGSe5rMN&q=85&s=6f9d5a08e9bf624f1ff7552ba5bc68ef" alt="Tableau 中的 ClickHouse 连接对话框，显示 server、port、database、username 和 password 字段" border width="621" height="552" data-path="images/integrations/data-visualization/tableau_connector_dialog.webp" />

<br />

6. 输入连接详细信息：

   | 设置       | 值                                  |
   | -------- | ---------------------------------- |
   | Server   | **你的 ClickHouse 主机名 (不带任何前缀或后缀) ** |
   | Port     | **8443**                           |
   | Database | **default**                        |
   | Username | **default**                        |
   | Password | \*\*\*\*\*\*                       |

<Note>
  使用 ClickHouse Cloud 时，必须勾选 SSL 复选框以启用安全连接。
</Note>

<br />

<Note>
  我们的 ClickHouse database 名为 **TPCD**，但你必须在上面的对话框中将 **Database** 设为 **default**，然后
  在下一步中将 **Schema** 选择为 **TPCD**。 (这很可能是连接器中的一个 bug 导致的，因此这种行为
  以后可能会改变，但目前你必须使用 **default** 作为 database。)
</Note>

7. 点击 **Sign In** 按钮后，你应该会看到一个新的 Tableau 工作簿：

<Image size="md" img="https://mintcdn.com/private-7c7dfe99/etDiFo_9fGSe5rMN/images/integrations/data-visualization/tableau_newworkbook.webp?fit=max&auto=format&n=etDiFo_9fGSe5rMN&q=85&s=a5c25ec395ad5ff55da56e11e898f515" alt="显示初始连接界面和数据库选择选项的新 Tableau 工作簿" border width="837" height="360" data-path="images/integrations/data-visualization/tableau_newworkbook.webp" />

<br />

8. 从 **Schema** 下拉菜单中选择 **TPCD**，你应该会看到 **TPCD** 中的表列表：

<Image size="md" img="https://mintcdn.com/private-7c7dfe99/etDiFo_9fGSe5rMN/images/integrations/data-visualization/tableau_tpcdschema.webp?fit=max&auto=format&n=etDiFo_9fGSe5rMN&q=85&s=8939bdba901959f9b5f3bcdcb6fe6913" alt="Tableau schema 选择界面，显示 TPCD 数据库中的表，包括 CUSTOMER、LINEITEM、NATION、ORDERS 等" border width="708" height="491" data-path="images/integrations/data-visualization/tableau_tpcdschema.webp" />

<br />

现在你已经可以在 Tableau 中构建一些可视化了！

<div id="building-visualizations-in-tableau">
  ## 在 Tableau 中创建可视化
</div>

现在我们已经在 Tableau 中配置好了 ClickHouse 数据源，接下来就来将数据可视化……

1. 将 **CUSTOMER** 表拖到工作簿中。注意，列已经显示出来了，但数据表还是空的：

<Image size="md" img="https://mintcdn.com/private-7c7dfe99/etDiFo_9fGSe5rMN/images/integrations/data-visualization/tableau_workbook1.webp?fit=max&auto=format&n=etDiFo_9fGSe5rMN&q=85&s=79b06bc6737e796ec0bdff784212aa1e" alt="将 CUSTOMER 表拖到画布后的 Tableau 工作簿，显示列标题但没有数据" border width="959" height="626" data-path="images/integrations/data-visualization/tableau_workbook1.webp" />

<br />

2. 点击 **Update Now** 按钮后，**CUSTOMER** 中的 100 行数据就会填充到表中。

3. 将 **ORDERS** 表拖入工作簿，然后将 **Custkey** 设置为这两个表之间的关联字段：

<Image size="md" img="https://mintcdn.com/private-7c7dfe99/etDiFo_9fGSe5rMN/images/integrations/data-visualization/tableau_workbook2.webp?fit=max&auto=format&n=etDiFo_9fGSe5rMN&q=85&s=f8dc6a82360db1a143397db048a42b72" alt="Tableau 关系编辑器，显示使用 Custkey 字段连接 CUSTOMER 和 ORDERS 表" border width="885" height="644" data-path="images/integrations/data-visualization/tableau_workbook2.webp" />

<br />

4. 现在，**ORDERS** 和 **LINEITEM** 表已经作为你的数据源关联起来了，因此你可以利用
   这种关系来回答与数据相关的问题。选择工作簿底部的 **Sheet 1** 选项卡。

<Image size="md" img="https://mintcdn.com/private-7c7dfe99/etDiFo_9fGSe5rMN/images/integrations/data-visualization/tableau_workbook3.webp?fit=max&auto=format&n=etDiFo_9fGSe5rMN&q=85&s=834f7da948ee9d2417e96f653c0080f0" alt="Tableau 工作表，显示可用于分析的 ClickHouse 表中的维度和度量" border width="1151" height="723" data-path="images/integrations/data-visualization/tableau_workbook3.webp" />

<br />

5. 假设你想了解每年订购了多少特定商品。将 **ORDERS** 中的 **OrderDate** 拖到
   **Columns** 区域 (横向字段) ，然后将 **LINEITEM** 中的 **Quantity** 拖到 **Rows**。Tableau 会
   生成如下折线图：

<Image size="sm" img="https://mintcdn.com/private-7c7dfe99/etDiFo_9fGSe5rMN/images/integrations/data-visualization/tableau_workbook4.webp?fit=max&auto=format&n=etDiFo_9fGSe5rMN&q=85&s=aeee34a322030014b3f5632e4202b330" alt="Tableau 折线图，显示 ClickHouse 数据中按年份统计的订购数量" border width="541" height="526" data-path="images/integrations/data-visualization/tableau_workbook4.webp" />

<br />

这并不是一张特别精彩的折线图，不过这个数据集是由脚本生成、专门用于测试查询性能的，所以
你会发现 TCPD 数据中的模拟订单变化并不大。

6. 假设你想了解按季度统计的平均订单金额 (美元) ，以及按运输方式 (空运、邮件、海运、
   卡车等) 细分的结果：

   * 点击 **New Worksheet** 选项卡以创建新工作表
   * 将 **ORDERS** 中的 **OrderDate** 拖到 **Columns** 中，并将其从 **Year** 改为 **Quarter**
   * 将 **LINEITEM** 中的 **Shipmode** 拖到 **Rows** 中

你应该会看到如下内容：

<Image size="sm" img="https://mintcdn.com/private-7c7dfe99/etDiFo_9fGSe5rMN/images/integrations/data-visualization/tableau_workbook5.webp?fit=max&auto=format&n=etDiFo_9fGSe5rMN&q=85&s=53d9f469400a8cf95eb53bb67dc86727" alt="Tableau 交叉表视图，以季度为列、运输方式为行" border width="368" height="313" data-path="images/integrations/data-visualization/tableau_workbook5.webp" />

<br />

7. **Abc** 值只是用来暂时填补空白区域，直到你将某个指标拖到表中。将 **Totalprice** 从 \*
   *ORDERS*\* 拖到表上。注意，默认计算方式是对 **Totalprices** 执行 **SUM**：

<Image size="md" img="https://mintcdn.com/private-7c7dfe99/8BDLB2eaYvpM3Jwt/images/integrations/data-visualization/tableau_workbook6.webp?fit=max&auto=format&n=8BDLB2eaYvpM3Jwt&q=85&s=0dde7e0c914bfe9266d43f0bd1a75b37" alt="Tableau 交叉表，显示按季度和运输方式统计的总订单金额之和" border width="665" height="383" data-path="images/integrations/data-visualization/tableau_workbook6.webp" />

<br />

8. 点击 **SUM**，将 **Measure** 改为 **Average**。在同一个下拉菜单中，选择 **Format**，然后将
   **Numbers** 改为 **Currency (Standard)**：

<Image size="md" img="https://mintcdn.com/private-7c7dfe99/8BDLB2eaYvpM3Jwt/images/integrations/data-visualization/tableau_workbook7.webp?fit=max&auto=format&n=8BDLB2eaYvpM3Jwt&q=85&s=01550b28e43d96174cf1d40891793549" alt="Tableau 交叉表，显示按季度和运输方式统计的平均订单金额，并采用货币格式" border width="804" height="379" data-path="images/integrations/data-visualization/tableau_workbook7.webp" />

<br />

做得好！你已经成功将 Tableau 连接到 ClickHouse，也为分析和可视化 ClickHouse 数据
打开了更广阔的空间。

<div id="install-the-connector-manually">
  ## 手动安装连接器
</div>

如果您使用的 Tableau Desktop 版本较旧，默认未包含该连接器，可以按照以下步骤手动安装：

1. 从 [Tableau Exchange](https://exchange.tableau.com/products/1064) 下载最新的 taco 文件
2. 将 taco 文件放到以下位置：
   * macOS: `~/Documents/My Tableau Repository/Connectors`
   * Windows: `C:\Users\[Windows User]\Documents\My Tableau Repository\Connectors`
3. 重启 Tableau Desktop。若安装成功，您将在 `New Data Source` 部分看到该连接器。

<div id="connection-and-analysis-tips">
  ## 连接与分析提示
</div>

如需进一步了解如何优化 Tableau 与 ClickHouse 的集成，
请参阅[连接提示](/docs/zh/integrations/connectors/data-visualization/tableau/tableau-connection-tips)和[分析提示](/docs/zh/integrations/connectors/data-visualization/tableau/tableau-analysis-tips)。

<div id="tests">
  ## 测试
</div>

该连接器目前使用 [TDVT 框架](https://tableau.github.io/connector-plugin-sdk/docs/tdvt) 进行测试，当前覆盖率为 97%。

<div id="summary">
  ## 摘要
</div>

您可以使用通用的 ODBC/JDBC ClickHouse 驱动程序将 Tableau 连接到 ClickHouse。不过，此连接器可简化连接设置流程。如果您在使用该连接器时遇到任何问题，欢迎通过 <a href="https://github.com/ClickHouse/clickhouse-tableau-connector-jdbc/issues" target="_blank">GitHub</a> 与我们联系。