Exploring data with Marimo notebooks and chDB
In this guide, you will learn how you can explore a dataset on ClickHouse Cloud data in Marimo notebook with the help of chDB - a fast in-process SQL OLAP Engine powered by ClickHouse.
Prerequisites:
- Python 3.8 or higher
- a virtual environment
- a working ClickHouse Cloud service and your connection details
If you don't yet have a ClickHouse Cloud account, you can sign up for a trial and get $300 in free-credits to begin.
What you'll learn:
- Connect to ClickHouse Cloud from Marimo notebooks using chDB
- Query remote datasets and convert results to Pandas DataFrames
- Visualize data using Plotly in Marimo
- Leverage Marimo's reactive execution model for interactive data exploration
We'll be using the UK Property Price dataset which is available on ClickHouse Cloud as one of the starter datasets. It contains data about the prices that houses were sold for in the United Kingdom from 1995 to 2024.
Setup
Loading the dataset
To add this dataset to an existing ClickHouse Cloud service, login to console.clickhouse.cloud with your account details.
In the left hand menu, click on Data sources. Then click Predefined sample data:
Select Get started in the UK property price paid data (4GB) card:
Then click Import dataset:
ClickHouse will automatically create the pp_complete table in the default database and fill the table with 28.92 million rows of price point data.
In order to reduce the likelihood of exposing your credentials, we recommend you add your Cloud username and password as environment variables on your local machine. From a terminal run the following command to add your username and password as environment variables:
Setting up credentials
The environment variables above persist only as long as your terminal session. To set them permanently, add them to your shell configuration file.
Installing Marimo
Now activate your virtual environment. From within your virtual environment, install the following packages that we will be using in this guide:
Create a new Marimo notebook with the following command:
A new browser window should open with the Marimo interface on localhost:2718:
Marimo notebooks are stored as pure Python files, making them easy to version control and share with others.
Installing dependencies
In a new cell, import the required packages:
If you hover your mouse over the cell you will see two circles with the "+" symbol appear. You can click these to add new cells.
Add a new cell and run a simple query to check that everything is set up correctly:
You should see the result shown underneath the cell you just ran:
Exploring the data
With the UK price paid data set up and chDB up and running in a Marimo notebook, we can now get started exploring our data.
Let's imagine we are interested in checking how price has changed with time for a specific area in the UK such as the capital city, London.
ClickHouse's remoteSecure function allows you to easily retrieve the data from ClickHouse Cloud.
You can instruct chDB to return this data in process as a Pandas data frame - which is a convenient and familiar way of working with data.
Querying ClickHouse Cloud data
Create a new cell with the following query to fetch the UK price paid data from your ClickHouse Cloud service and turn it into a pandas.DataFrame:
In the snippet above, chdb.query(query, "DataFrame") runs the specified query and outputs the result as a Pandas DataFrame.
In the query we are using the remoteSecure function to connect to ClickHouse Cloud.
The remoteSecure functions takes as parameters:
- a connection string
- the name of the database and table to use
- your username
- your password
As a security best practice, you should prefer using environment variables for the username and password parameters rather than specifying them directly in the function, although this is possible if you wish.
The remoteSecure function connects to the remote ClickHouse Cloud service, runs the query and returns the result.
Depending on the size of your data, this could take a few seconds.
In this case we return an average price point per year, and filter by town='LONDON'.
The result is then stored as a DataFrame in a variable called df.
Visualizing the data
With the data now available to us in a familiar form, let's explore how prices of property in London have changed with time.
Marimo works particularly well with interactive plotting libraries like Plotly. In a new cell, create an interactive chart:
Perhaps unsurprisingly, property prices in London have increased substantially over time.
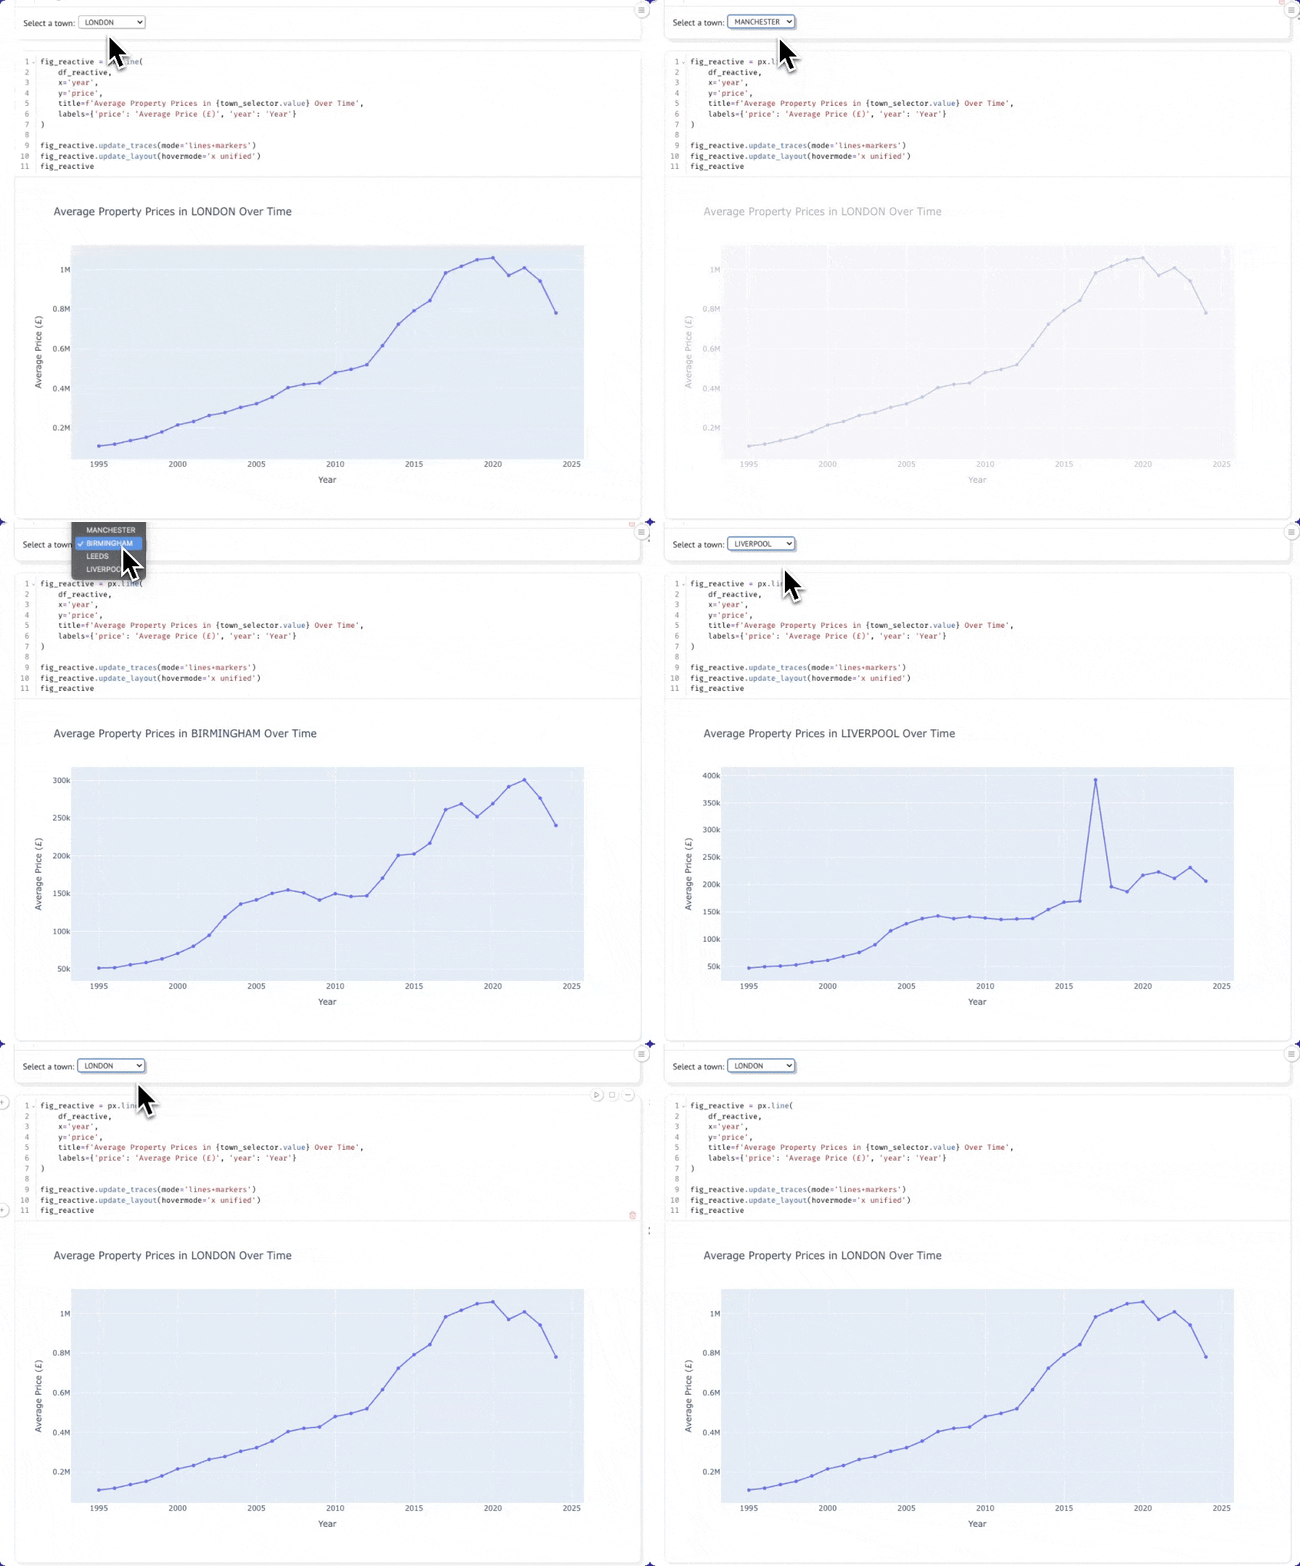
One of Marimo's strengths is its reactive execution model. Let's create an interactive widget to select different towns dynamically.
Interactive town selection
In a new cell, create a dropdown to select different towns:
In another cell, create a query that reacts to the town selection. When you change the dropdown, this cell will automatically re-execute:
Now create a chart that updates automatically when you change the town. You can move the chart above the dynamic dataframe so that it appears below the cell with the dropdown.
Now when you select a town from the drop-down the chart will update dynamically:

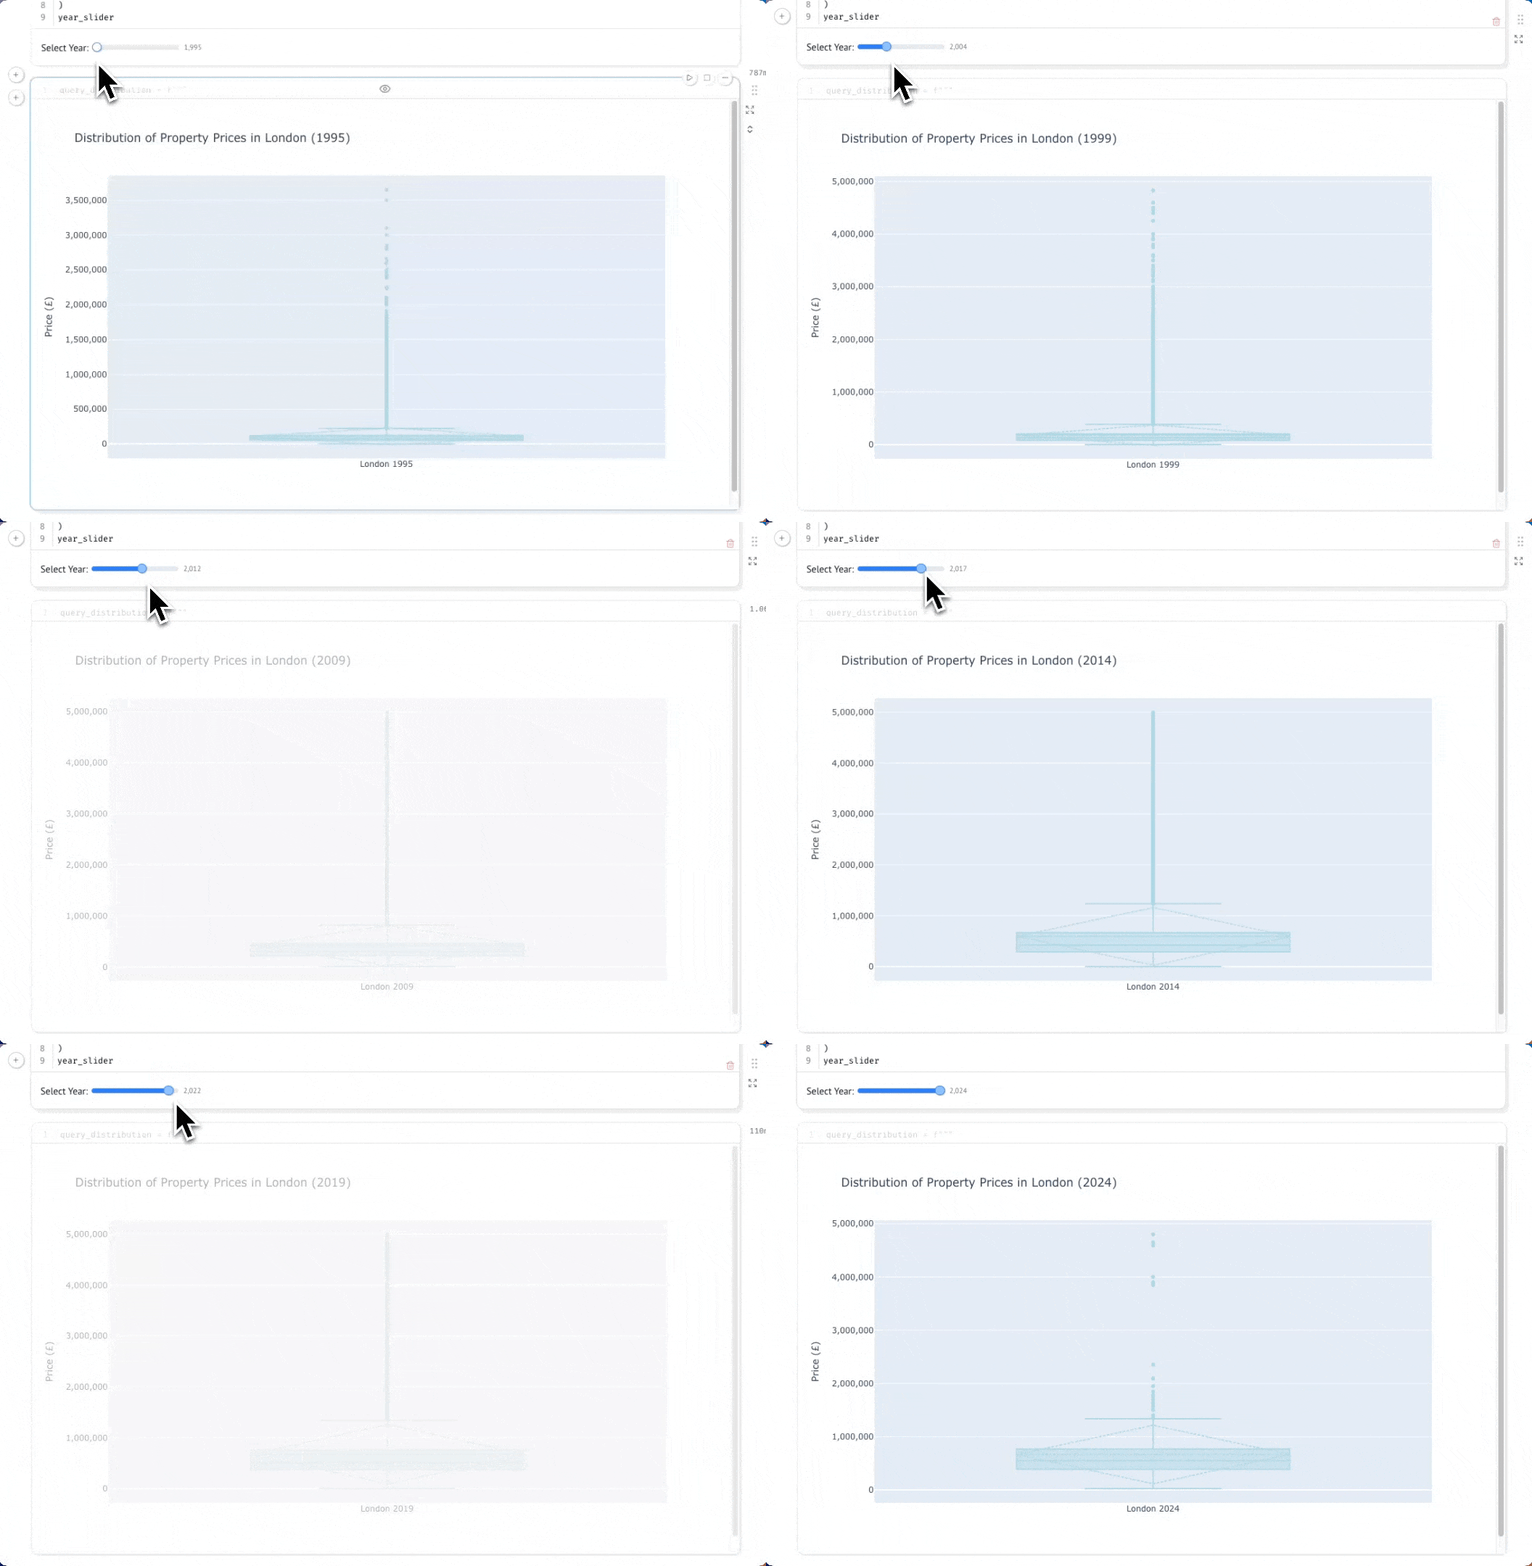
Exploring price distributions with interactive box plots
Let's dive deeper into the data by examining the distribution of property prices in London for different years. A box and whisker plot will show us the median, quartiles, and outliers, giving us a much better understanding than just the average price. First, let's create a year slider that will let us interactively explore different years:
In a new cell, add the following:
Now, let's query the individual property prices for the selected year. Note that we're not aggregating here - we want all the individual transactions to build our distribution:
If you select the options button in the top right hand of the cell, you can hide the code. As you move the slider, the plot will automatically update thanks to Marimo's reactive execution:

Summary
This guide demonstrated how you can use chDB to explore your data in ClickHouse Cloud using Marimo notebooks.
Using the UK Property Price dataset, we showed how to query remote ClickHouse Cloud data with the remoteSecure() function, and convert results directly to Pandas DataFrames for analysis and visualization.
Through chDB and Marimo's reactive execution model, data scientists can leverage ClickHouse's powerful SQL capabilities alongside familiar Python tools like Pandas and Plotly, with the added benefit of interactive widgets and automatic dependency tracking that make exploratory analysis more efficient and reproducible.

