Дашборд мониторинга Managed Postgres
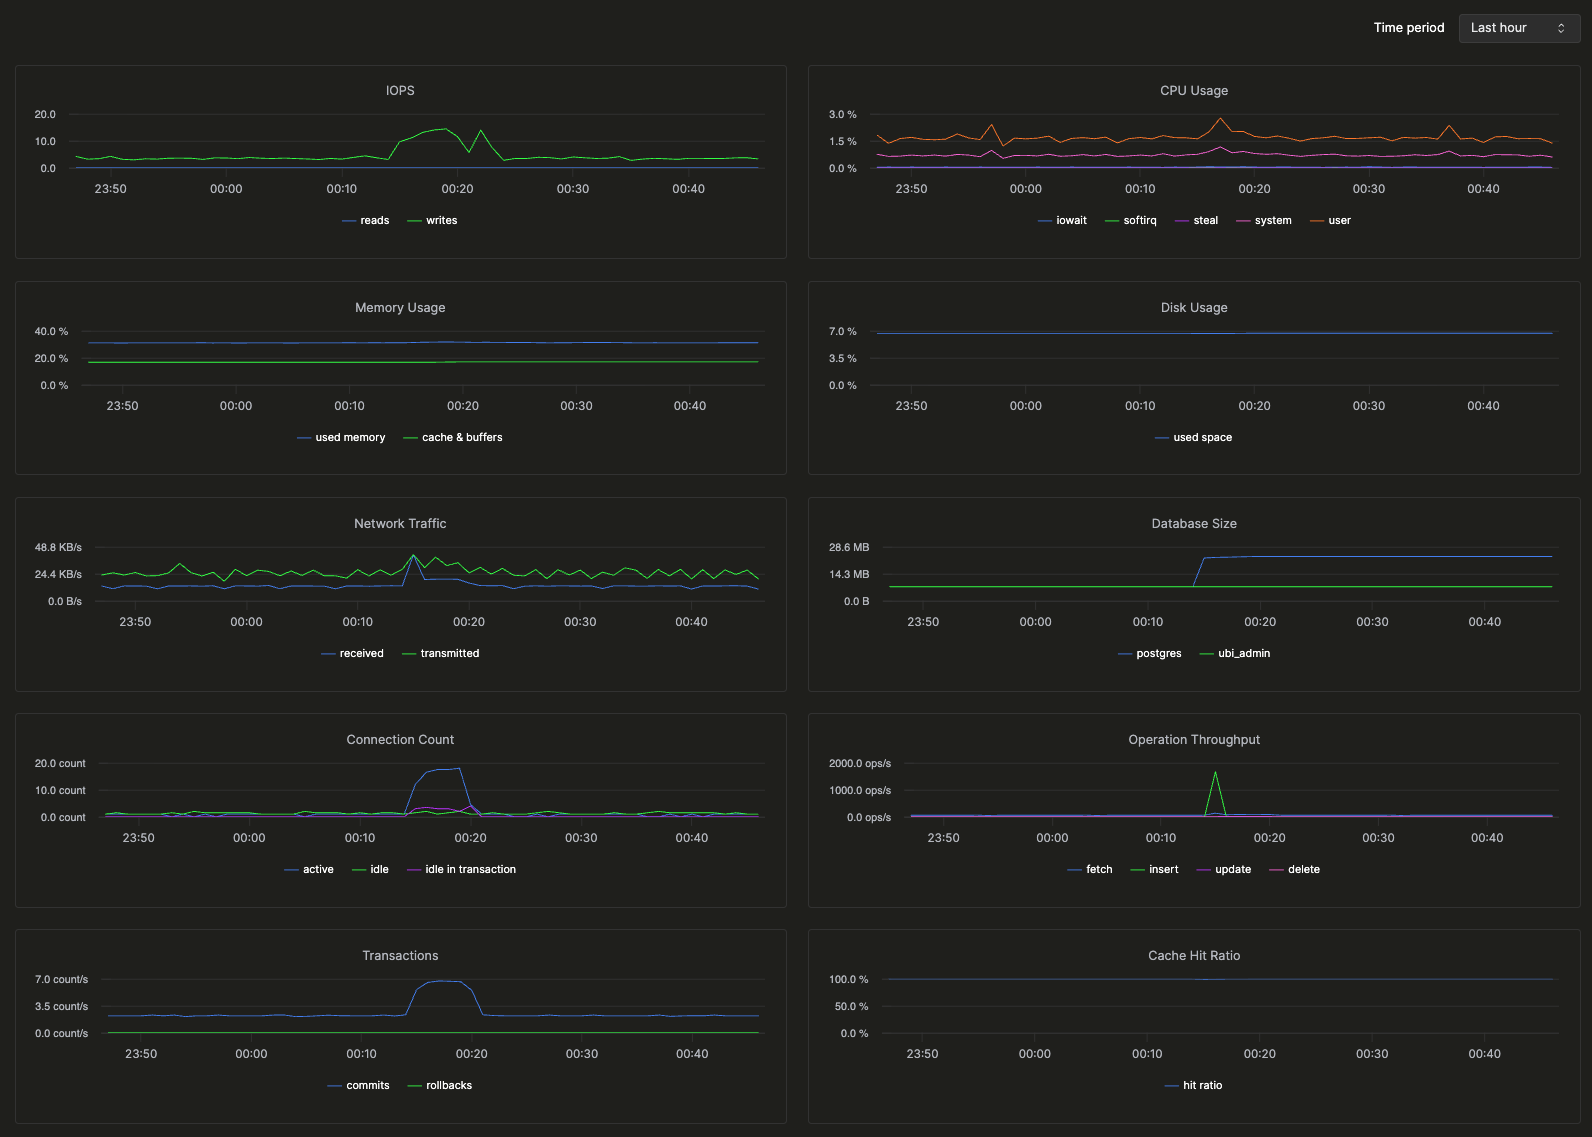
Вкладка Мониторинг на левой боковой панели экземпляра показывает диаграммы использования ресурсов и активности базы данных в реальном времени за выбранный временной период.
Панели
На дашборде метрики сгруппированы в следующие панели:
- IOPS — количество операций чтения и записи на диске в секунду
- Использование CPU — с разбивкой по
user,system,iowait,softirqиsteal - Использование памяти — объем используемой памяти, кэша и буферов в процентах от общего объема
- Использование диска — используемое пространство файловой системы в процентах от объема хранилища, выделенного сервису
- Сетевой трафик — полученные и переданные байты
- Размер базы данных — размер каждой базы данных в байтах (включая
postgresпо умолчанию и все базы данных, созданные пользователем) - Количество соединений — активные и бездействующие соединения
- Пропускная способность операций — выборки, вставки, обновления и удаления в секунду
- Транзакции — подтверждения и откаты в секунду
- Коэффициент попаданий в кэш — процент чтений блоков, выполняемых из буферного кэша, а не с диска
- Взаимные блокировки — взаимные блокировки, обнаруженные сервером
Временной период
Используйте селектор Временной период, чтобы переключаться между последним часом, днём, неделей или произвольным диапазоном.
Связанные страницы
- конечная точка Prometheus — собирайте те же метрики в свой стек обсервабилити
- Справочник по метрикам — полный список метрик с типами и метками
