ローカルログとメトリクス
このクイックスタートガイドでは、ローカル環境のログとメトリクスを収集し、それらを可視化と分析のために ClickStack に送信する手順を説明します。
このサンプルは OSX および Linux システムでのみ動作します
- マネージド版 ClickStack
- ClickStack オープンソース版
このガイドは、マネージドClickStackの入門ガイドを完了し、接続認証情報を記録済みであることを前提としています。
カスタムOpenTelemetry設定の作成
以下の内容で custom-local-config.yaml ファイルを作成します:
この設定は、OSXおよびLinuxシステムのシステムログとメトリクスを収集し、結果をClickStackに送信します。この設定では、新しいレシーバーとパイプラインを追加することでClickStackコレクターを拡張します。ベースのClickStackコレクターで既に設定されているclickhouseエクスポーターとプロセッサー(memory_limiter、batch)を参照してください。
この設定は、インジェスト時にタイムスタンプを調整し、各イベントに更新された時刻値を割り当てます。正確なイベント時刻を保持するために、ログファイル内のOTelプロセッサまたはオペレータを使用してタイムスタンプの前処理または解析を行うことを推奨します。
この設定例では、レシーバーまたはファイルプロセッサがファイルの先頭から開始するように構成されている場合、既存のすべてのログエントリには同一の調整済みタイムスタンプが割り当てられます。これは元のイベント時刻ではなく、処理時刻です。ファイルに追加される新しいイベントには、実際の生成時刻に近似したタイムスタンプが付与されます。
この動作を回避するには、レシーバー設定で開始位置を end に設定します。これにより、新しいエントリのみが取り込まれ、実際の到着時刻に近いタイムスタンプが付与されます。
OpenTelemetry (OTel) の設定構造の詳細については、公式ガイドを参照してください。
システムログを確認する
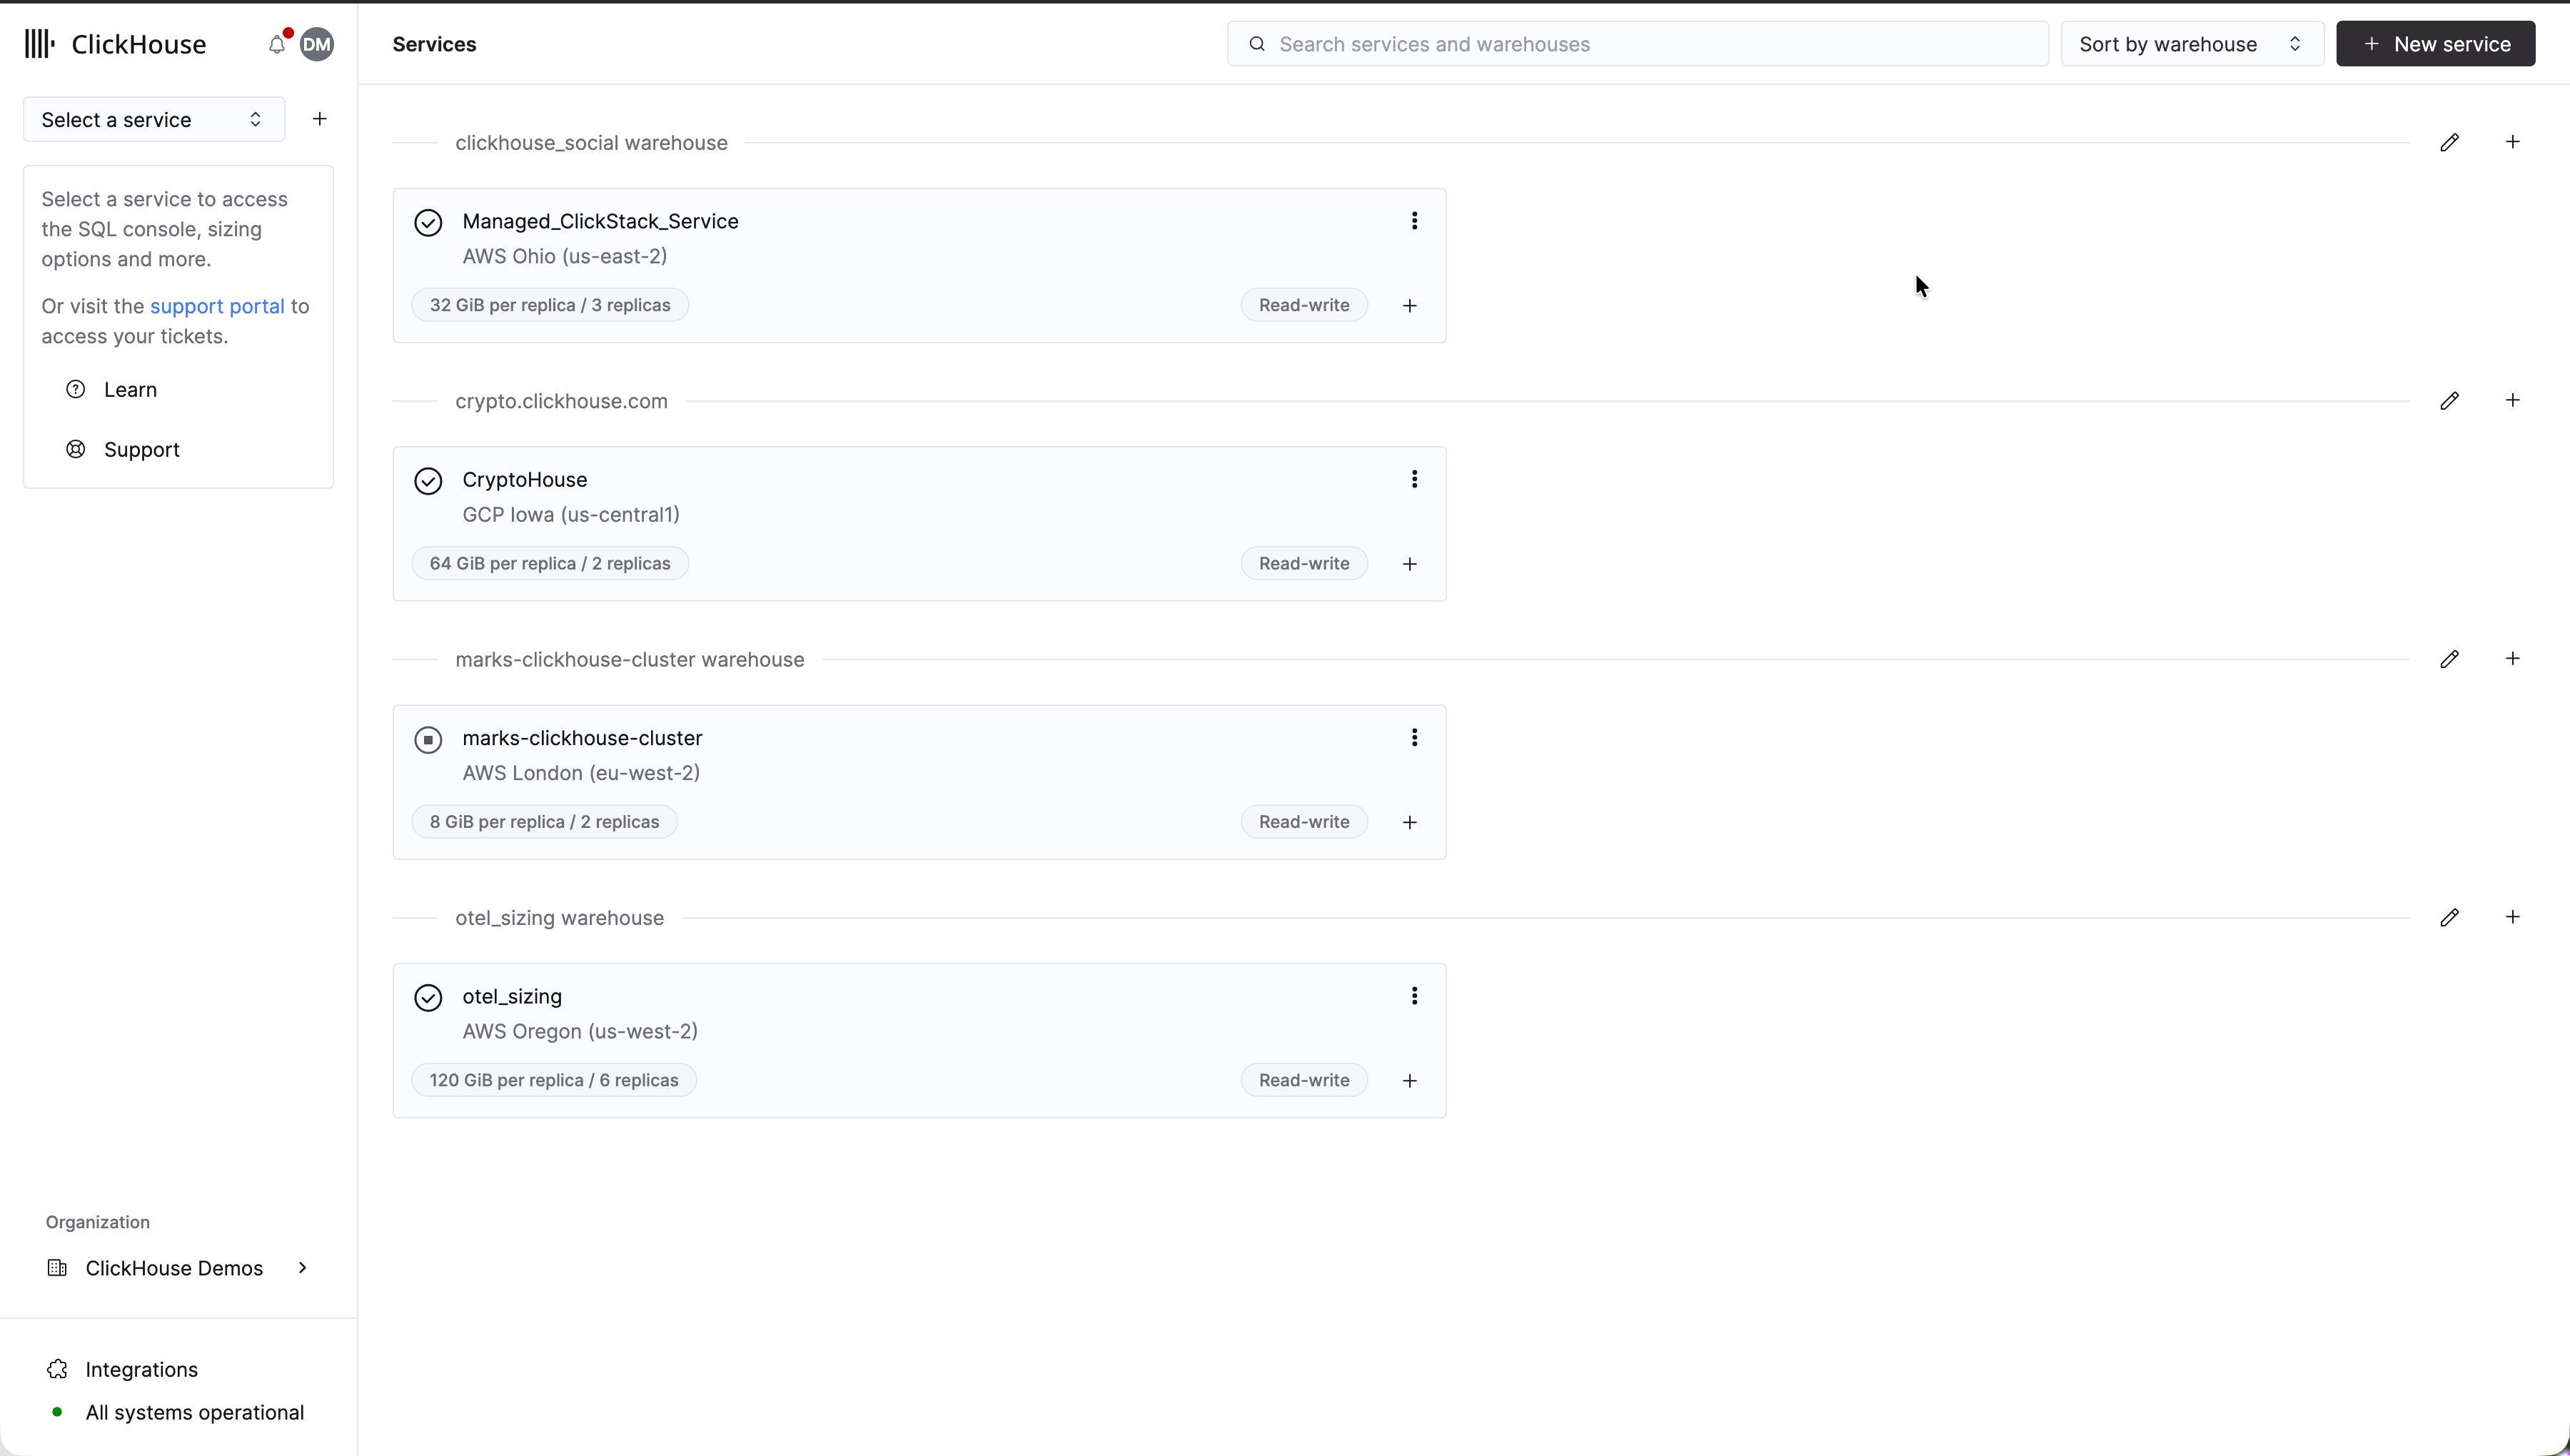
左側のメニューからClickStackを選択してClickStack UIに移動すると、自動的に認証されます。
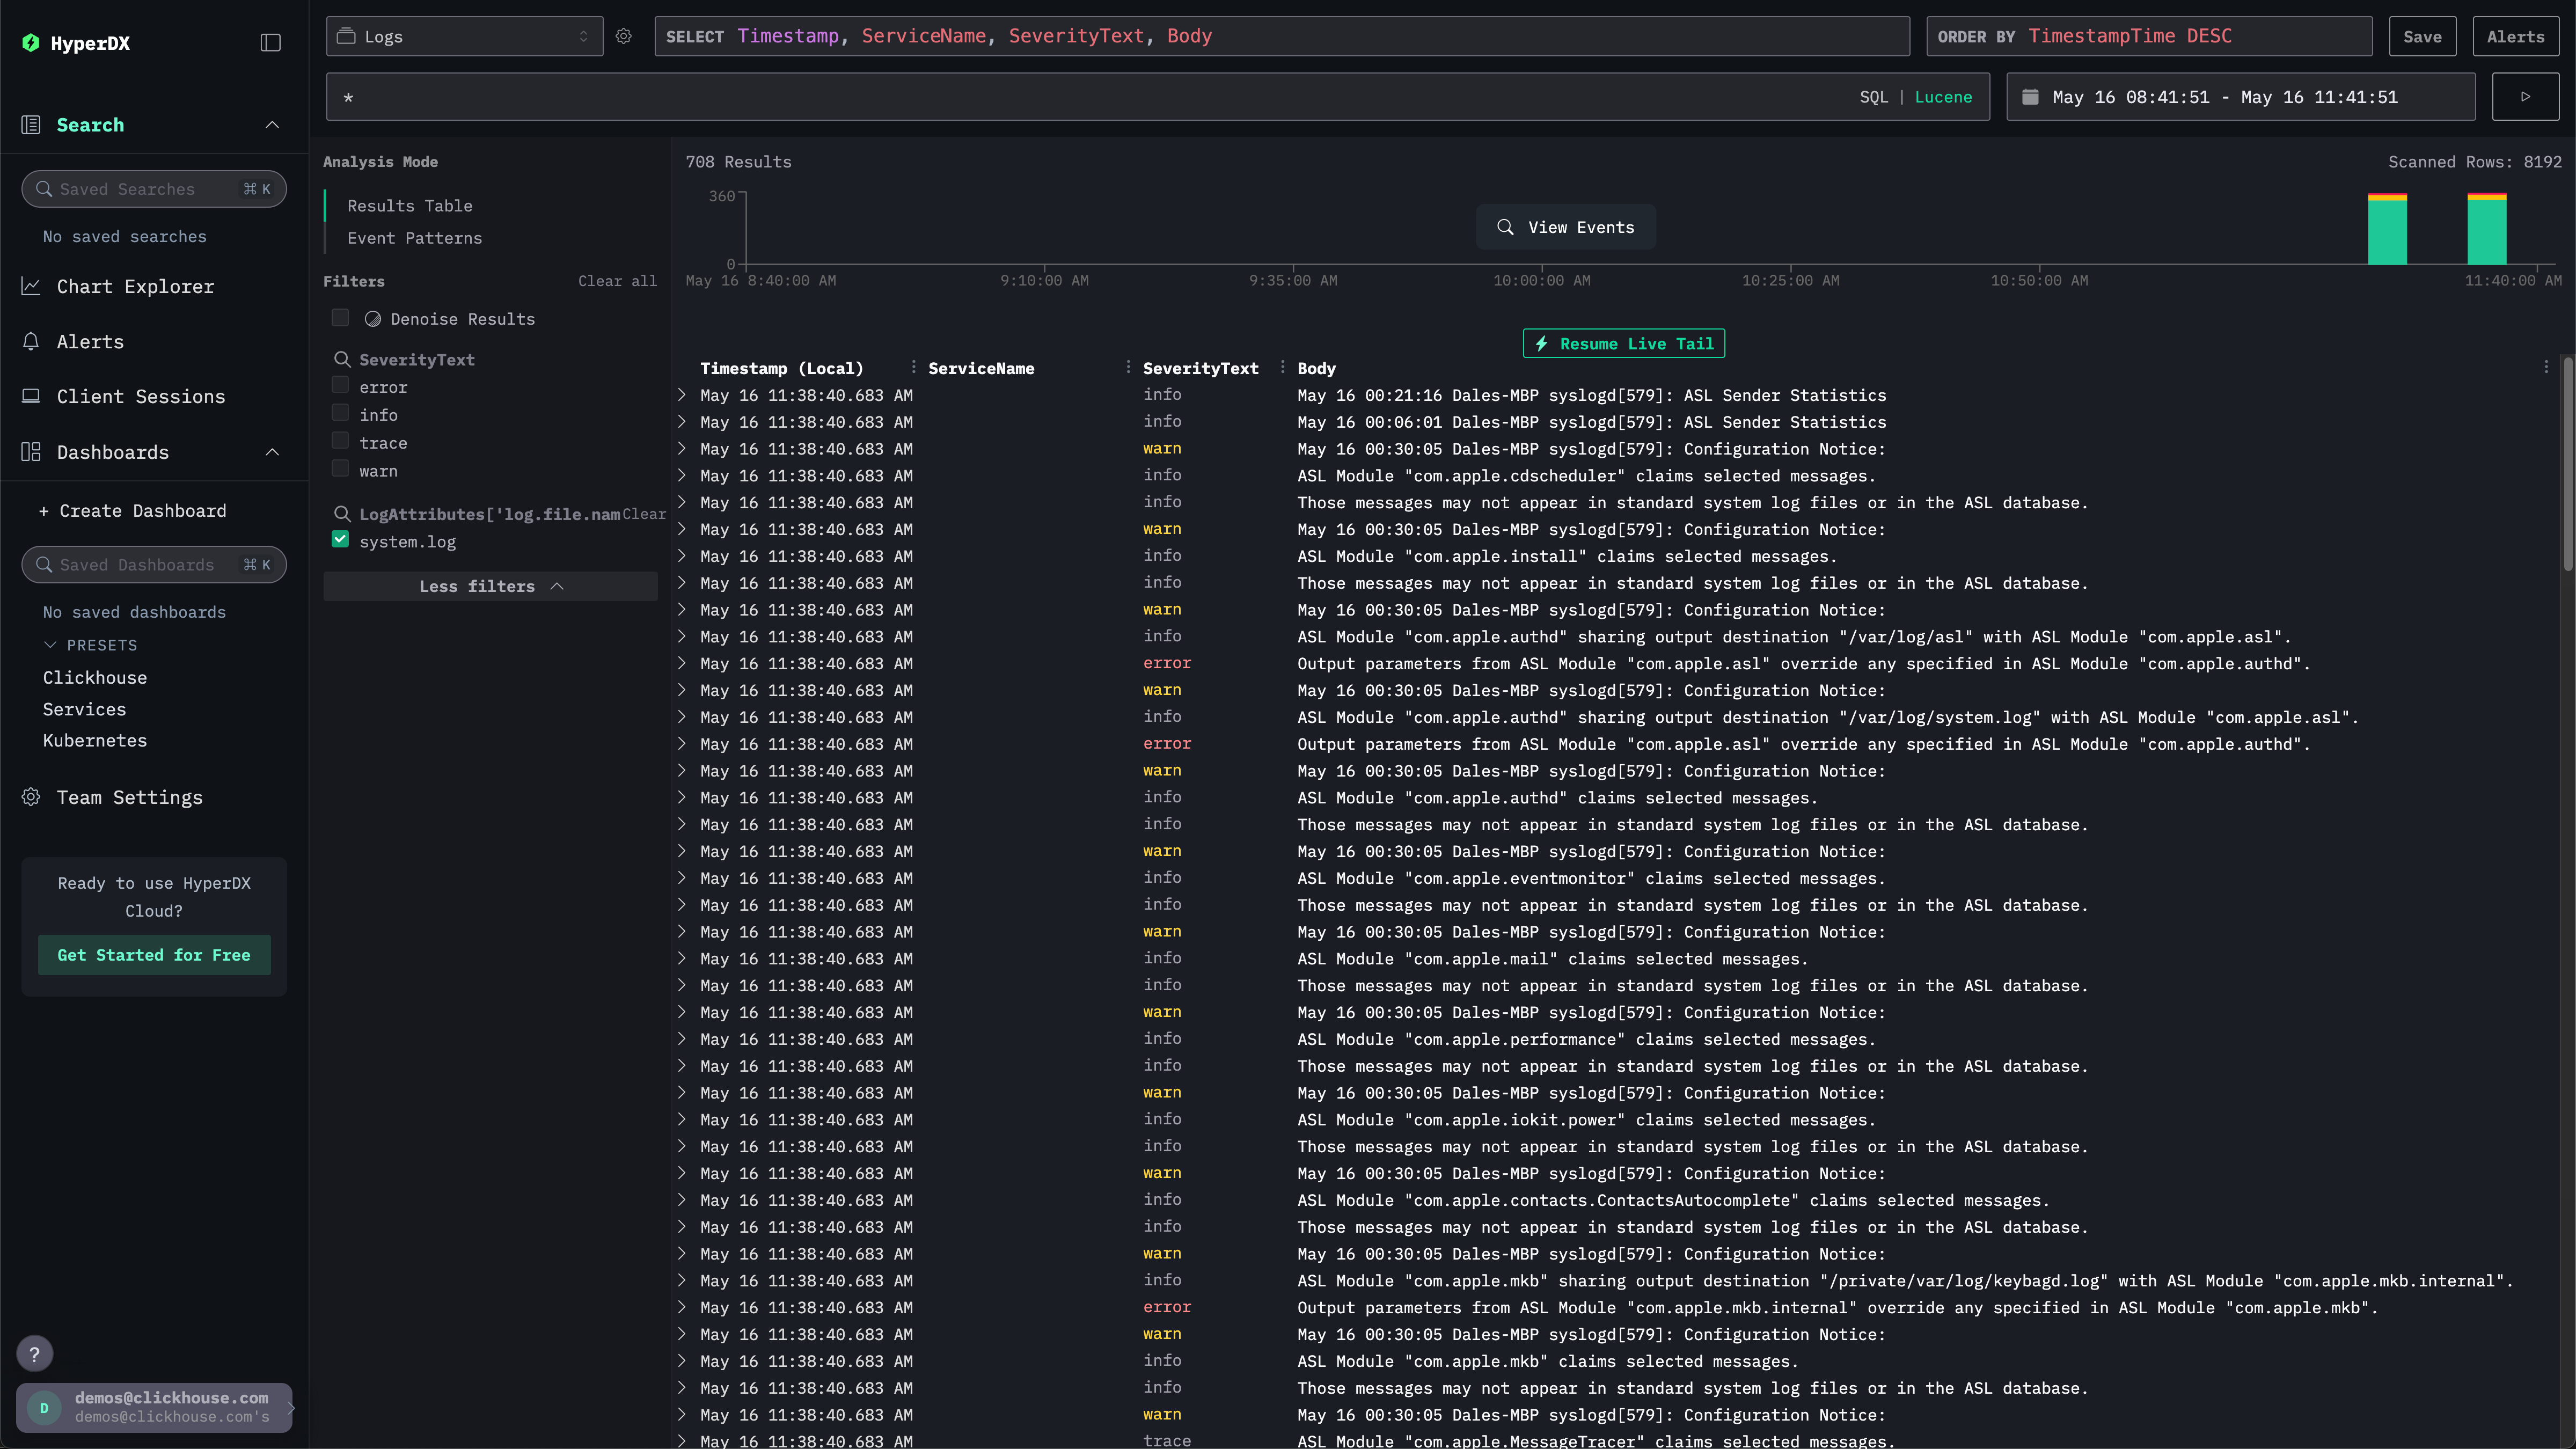
検索UIにローカルシステムログが表示されます。フィルタを展開してsystem.logを選択してください:
システムメトリクスを探索する
チャートを使用してメトリクスを確認できます。
左側のメニューからChart Explorerに移動します。ソースとしてMetricsを選択し、集計タイプとしてMaximumを選択してください。
Select a Metricメニューで、system.memory.utilization (Gauge)を選択する前にmemoryと入力します。
実行ボタンを押して、メモリ使用率の時系列推移を可視化してください。
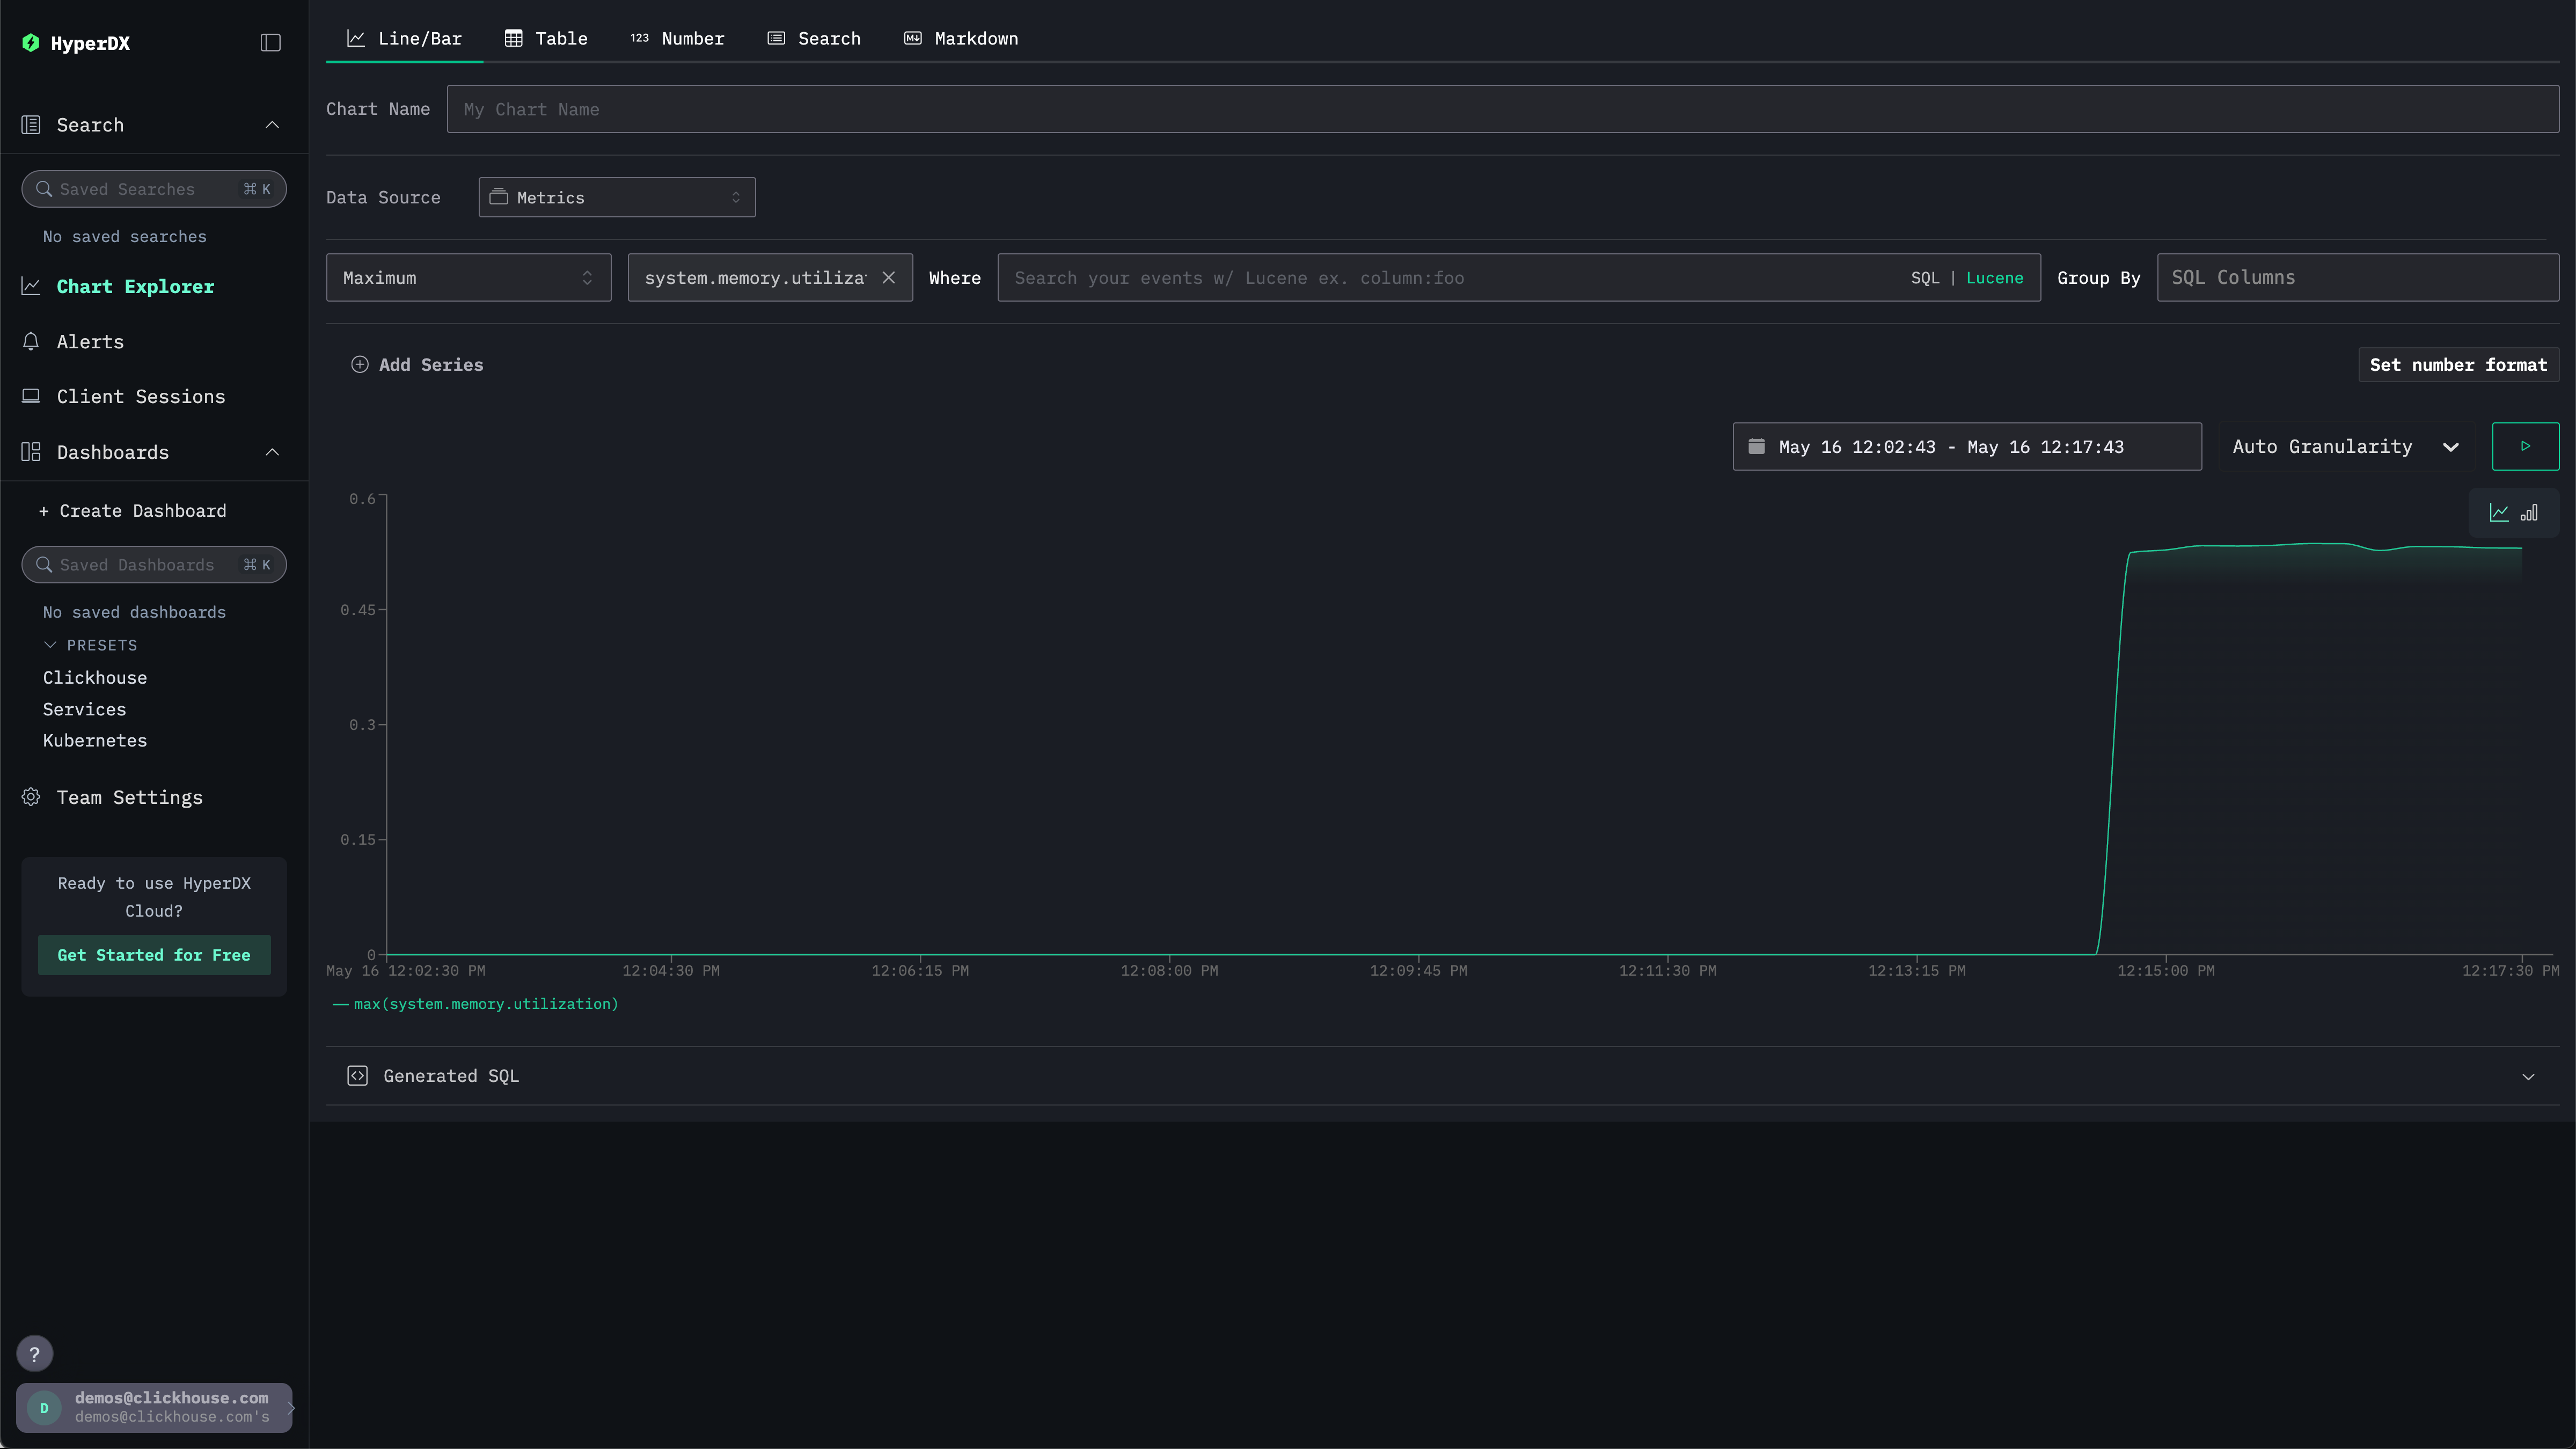
数値は浮動小数点の%として返されることに注意してください。より明確に表示するには、Set number formatを選択してください。
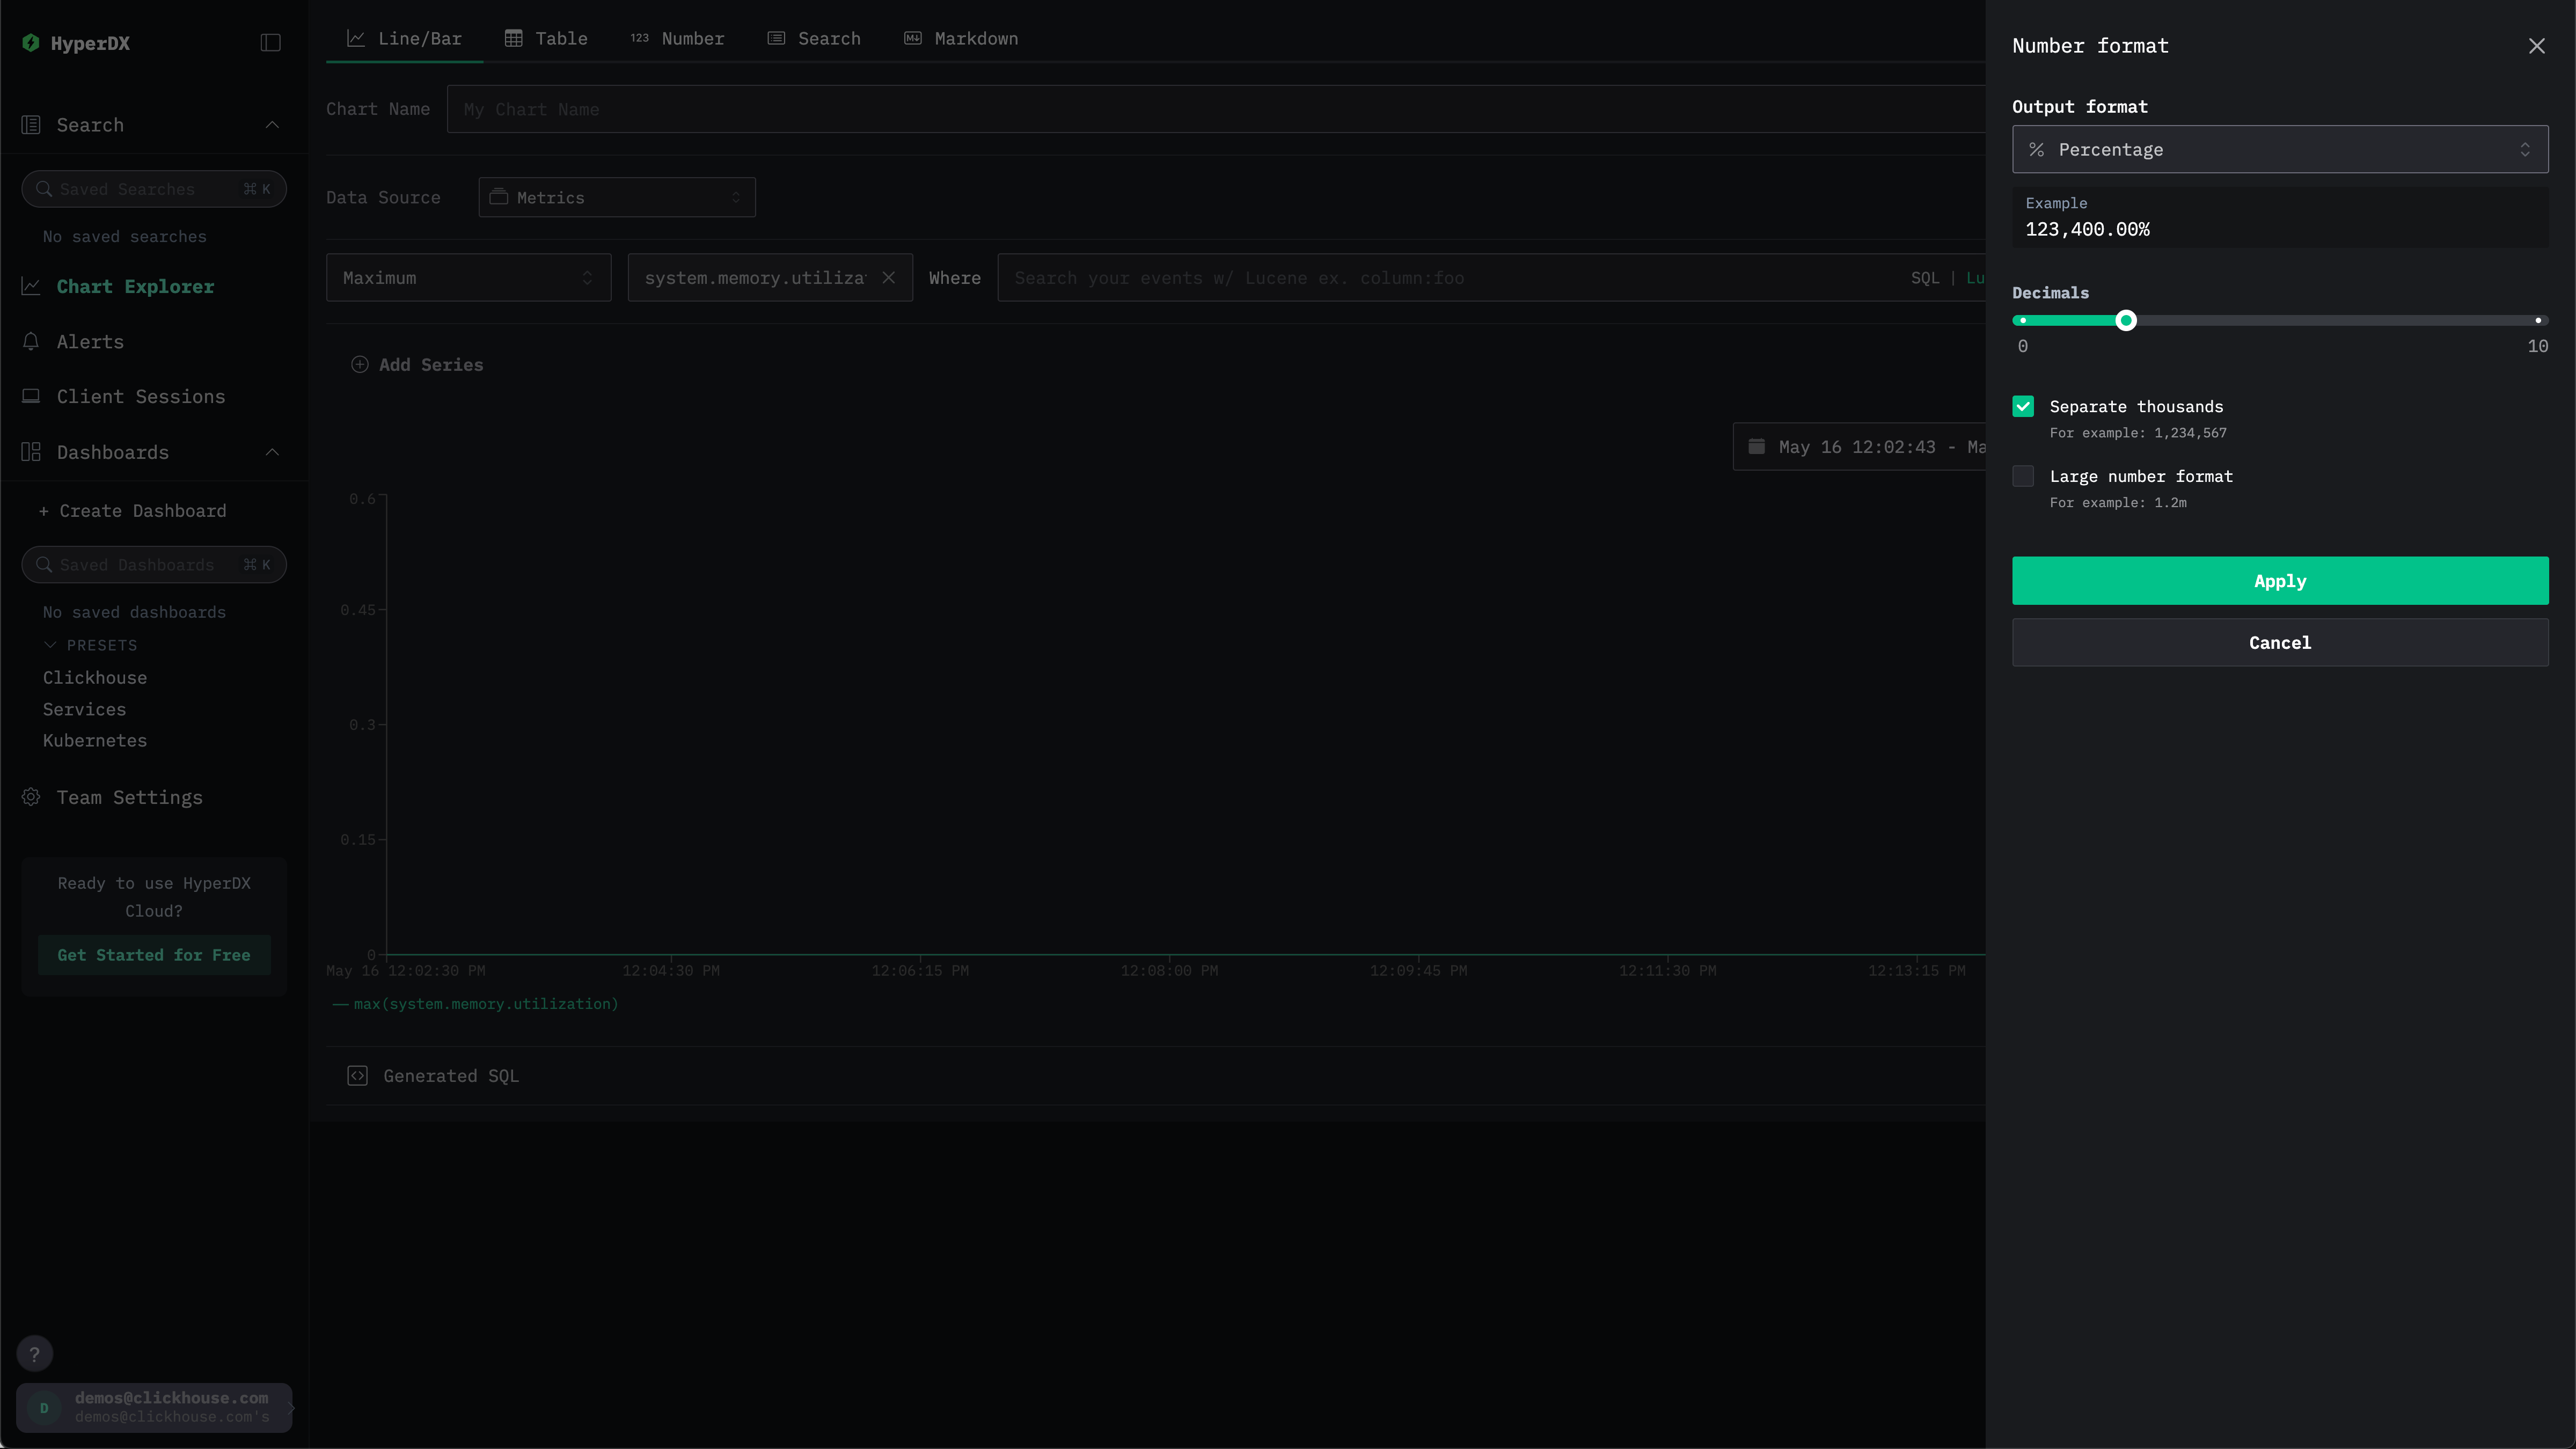
次のメニューから、Output formatドロップダウンでPercentageを選択してから、Applyをクリックします。

