Zing Data を ClickHouse に接続する
Zing Data は、データ探索および可視化のためのプラットフォームです。Zing Data は、ClickHouse が提供する JavaScript ドライバーを使用して ClickHouse に接続します。
接続手順
- 接続情報を収集します。
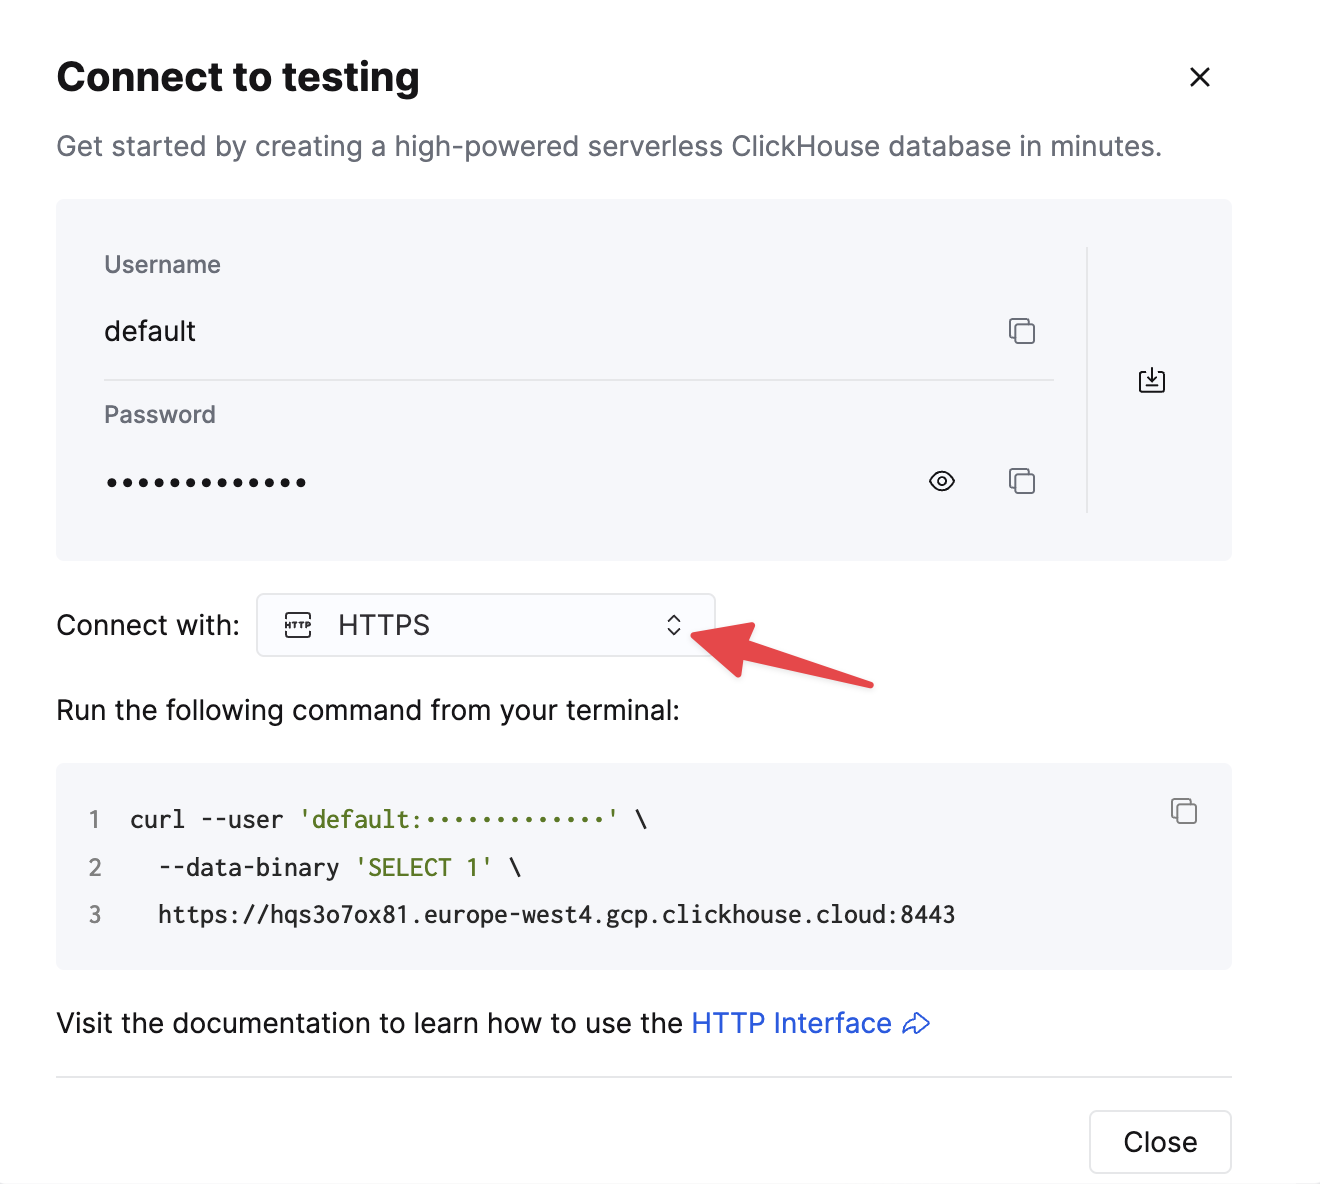
HTTP(S) で ClickHouse に接続するには、次の情報が必要です。
| Parameter(s) | Description |
|---|---|
HOST and PORT | 通常、TLS を使用する場合のポートは 8443、TLS を使用しない場合のポートは 8123 です。 |
DATABASE NAME | 既定で default という名前のデータベースが用意されています。接続したいデータベースの名前を使用してください。 |
USERNAME and PASSWORD | 既定のユーザー名は default です。用途に応じて適切なユーザー名を使用してください。 |
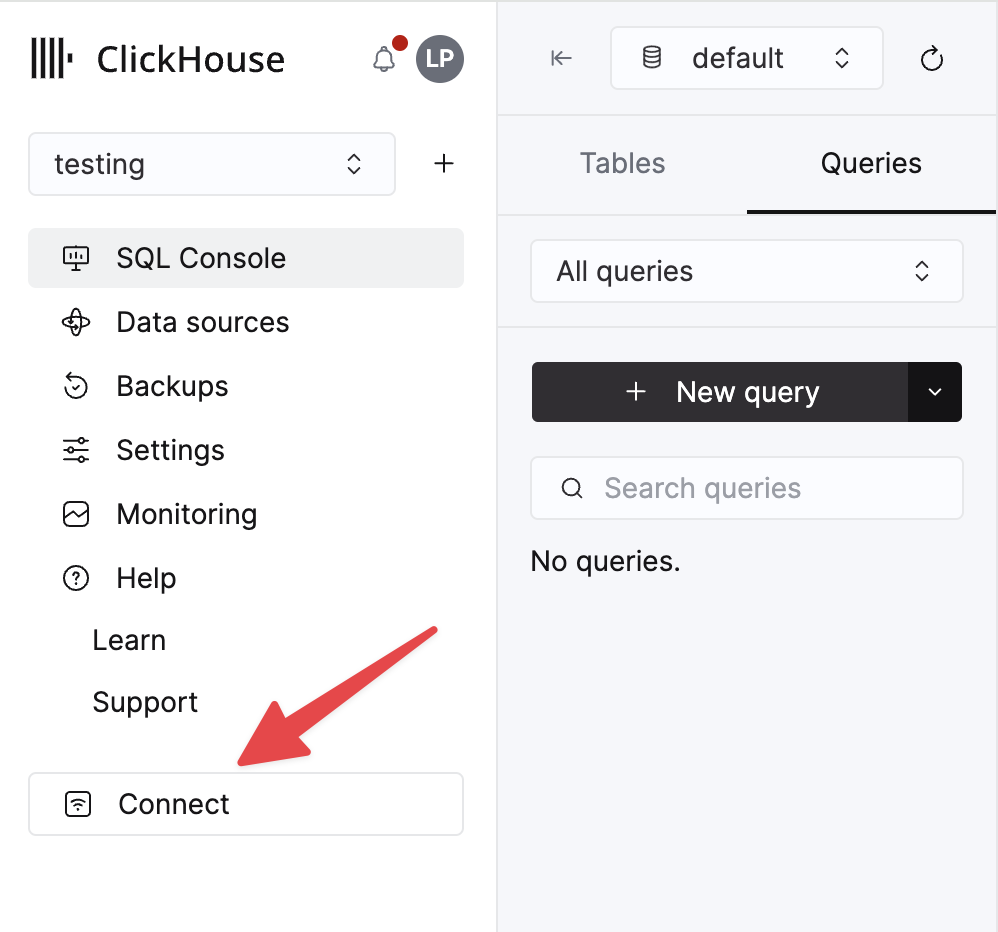
ClickHouse Cloud サービスに関する詳細情報は、ClickHouse Cloud コンソールで確認できます。 サービスを選択し、Connect をクリックします。
HTTPS を選択します。接続情報は、サンプルの curl コマンド内に表示されます。
セルフマネージドの ClickHouse を使用している場合、接続情報は ClickHouse 管理者によって設定されます。
-
Zing Data をダウンロードするか、Web 版にアクセスします
-
モバイルで Zing Data と ClickHouse を使用するには、Google Play Store もしくは Apple App Store から Zing Data アプリをダウンロードします。
-
Web で Zing Data と ClickHouse を使用するには、Zing web console にアクセスしてアカウントを作成します。
-
-
データソースを追加します
-
Zing Data から ClickHouse のデータを操作するには、データソース を定義する必要があります。Zing Data のモバイルアプリのメニューで Sources を選択し、Add a Datasource をクリックします。
-
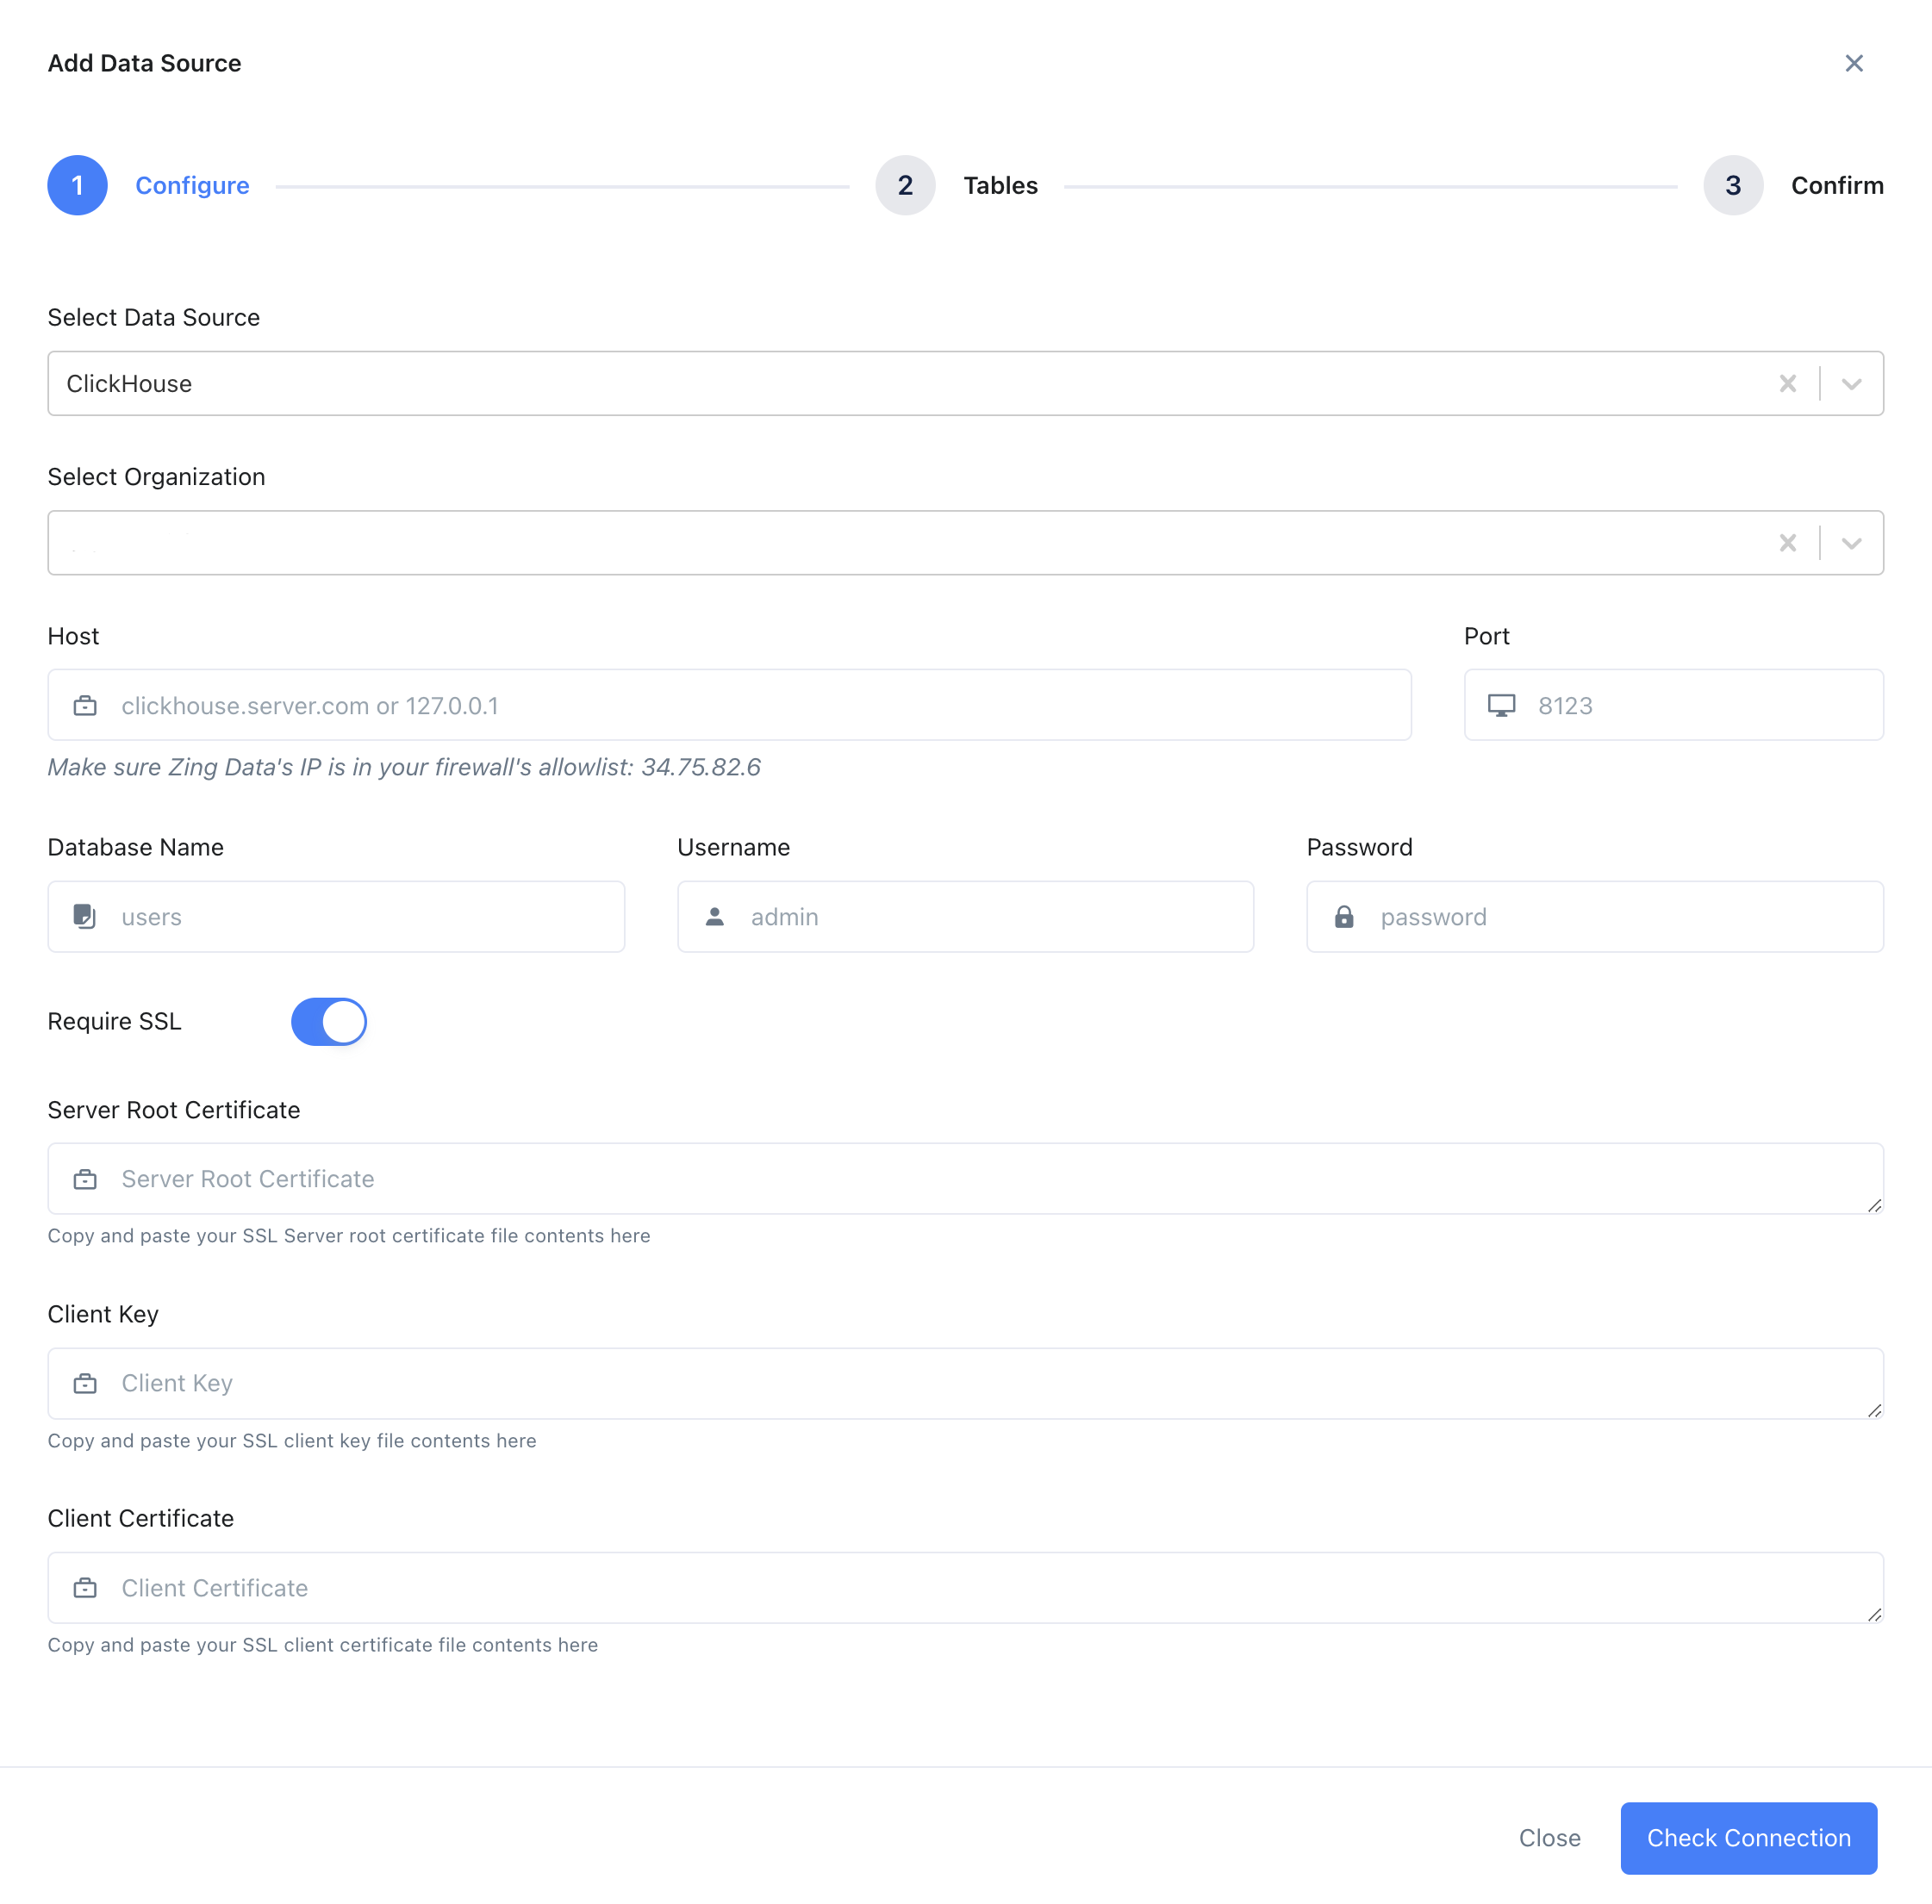
Web でデータソースを追加するには、上部メニューの Data Sources をクリックし、New Datasource をクリックして、ドロップダウンメニューから ClickHouse を選択します。

-
-
接続情報を入力し、Check Connection をクリックします。
-
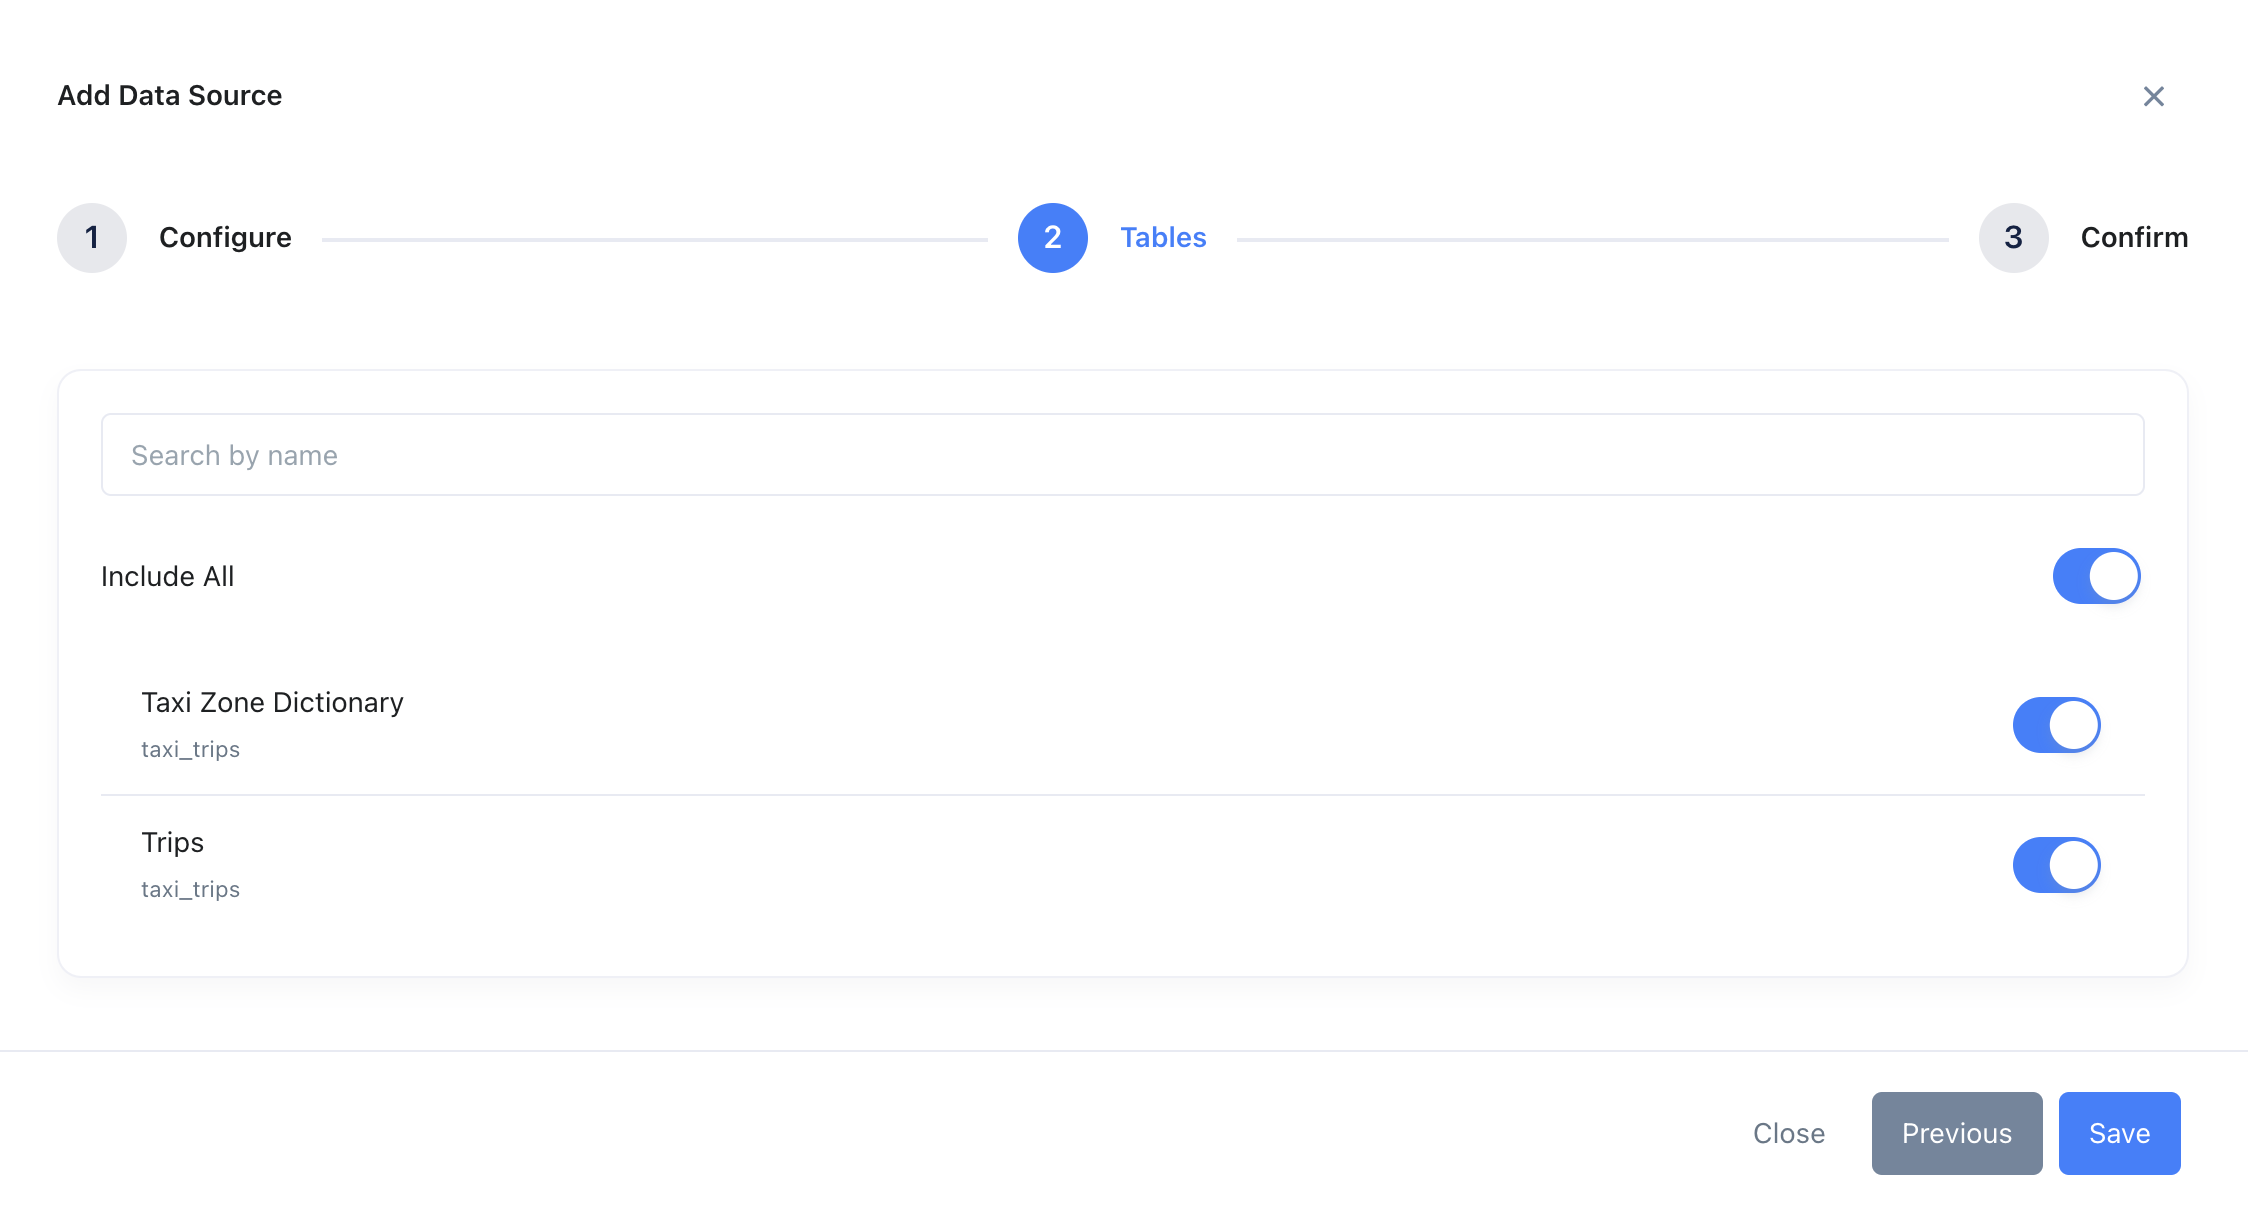
接続に成功すると、Zing はテーブル選択画面に進みます。必要なテーブルを選択し、Save をクリックします。Zing がデータソースに接続できない場合は、認証情報を確認して再試行するよう促すメッセージが表示されます。認証情報を確認して再試行しても問題が解決しない場合は、こちらから Zing サポートに問い合わせてください。
-
ClickHouse のデータソースが追加されると、Zing 組織内の全ユーザーが Data Sources / Sources タブから利用できるようになります。
Zing Data でチャートとダッシュボードを作成する
-
ClickHouse データソースが追加されたら、Web では Zing App をクリックし、モバイルではデータソースをタップしてチャートの作成を開始します。
-
テーブル一覧から任意のテーブルをクリックしてチャートを作成します。
-
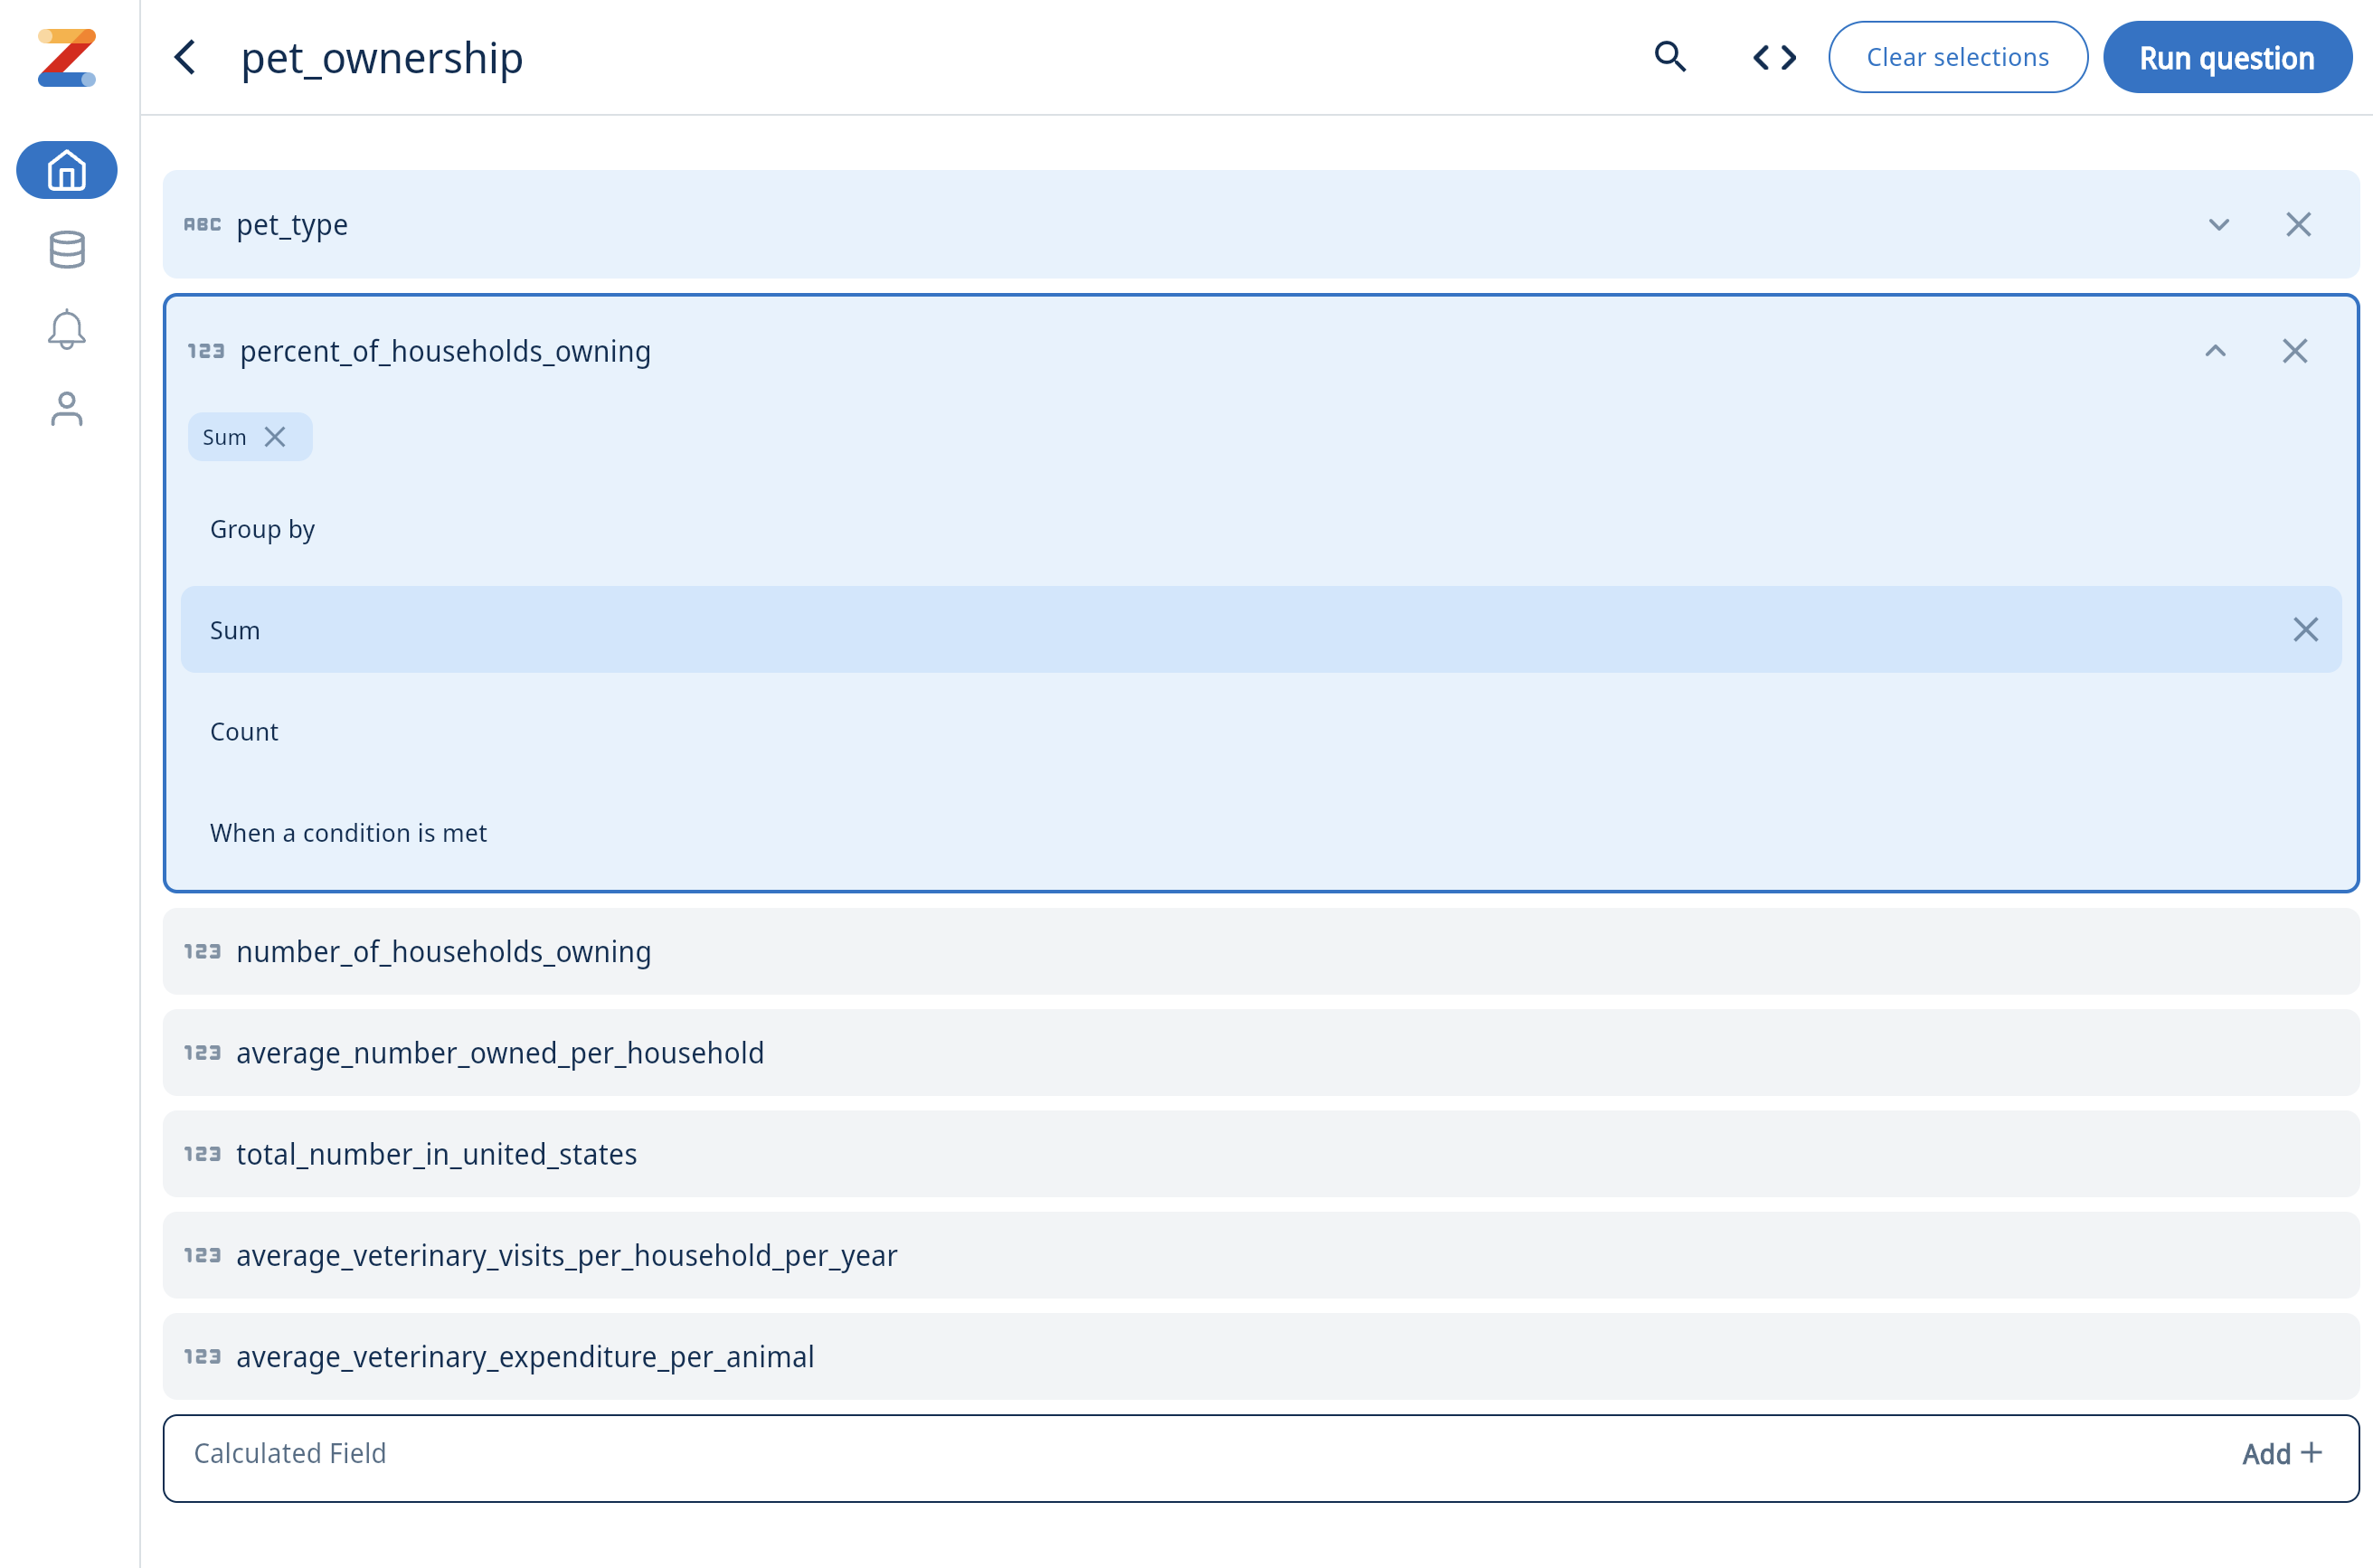
ビジュアルクエリビルダーを使用して、必要なフィールドや集計などを選択し、Run Question をクリックします。
-
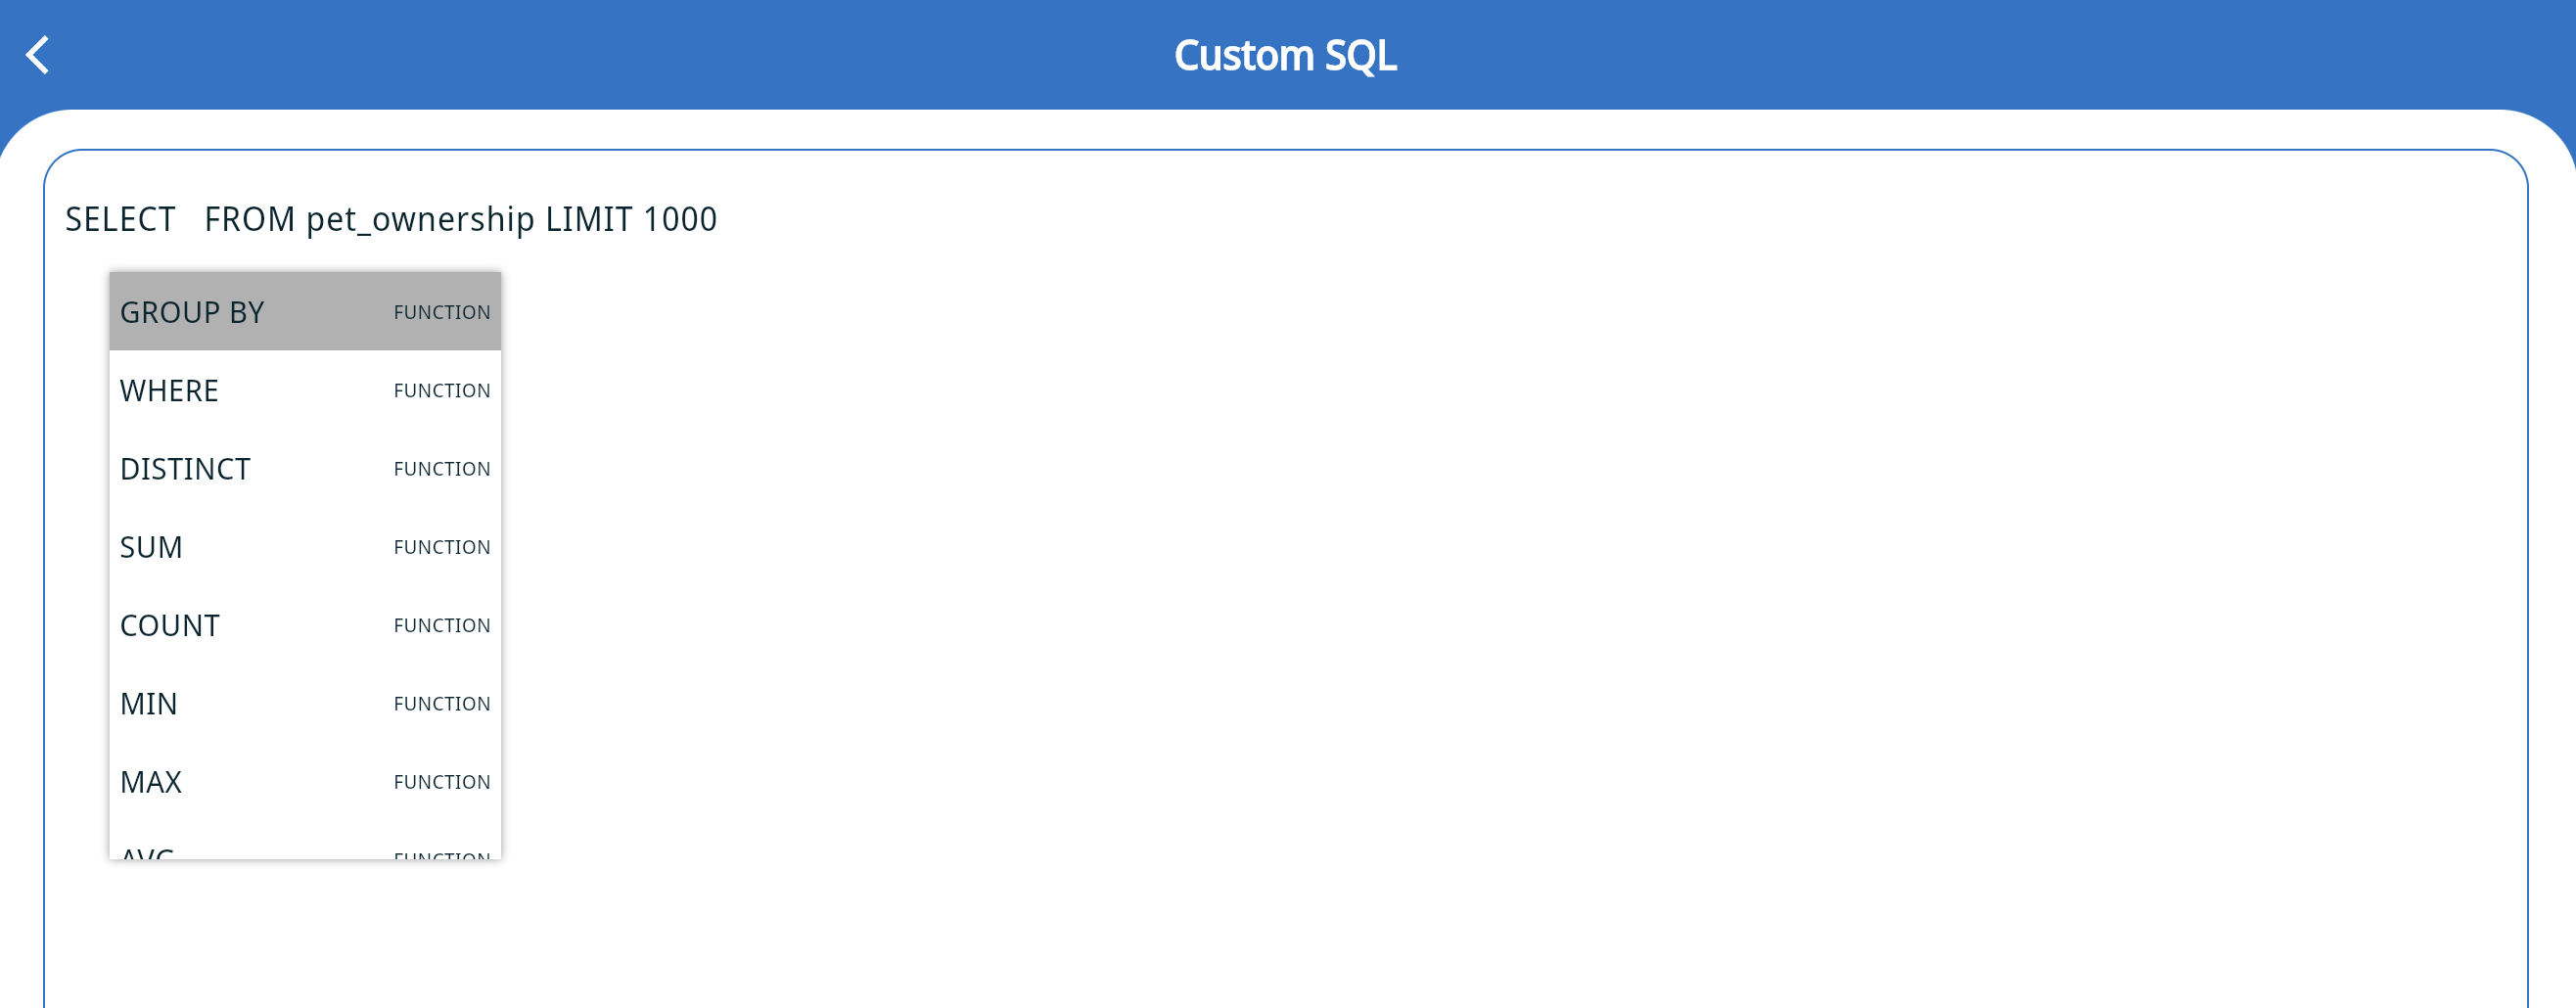
SQL に慣れている場合は、カスタム SQL を記述してクエリを実行し、チャートを作成することもできます。

-
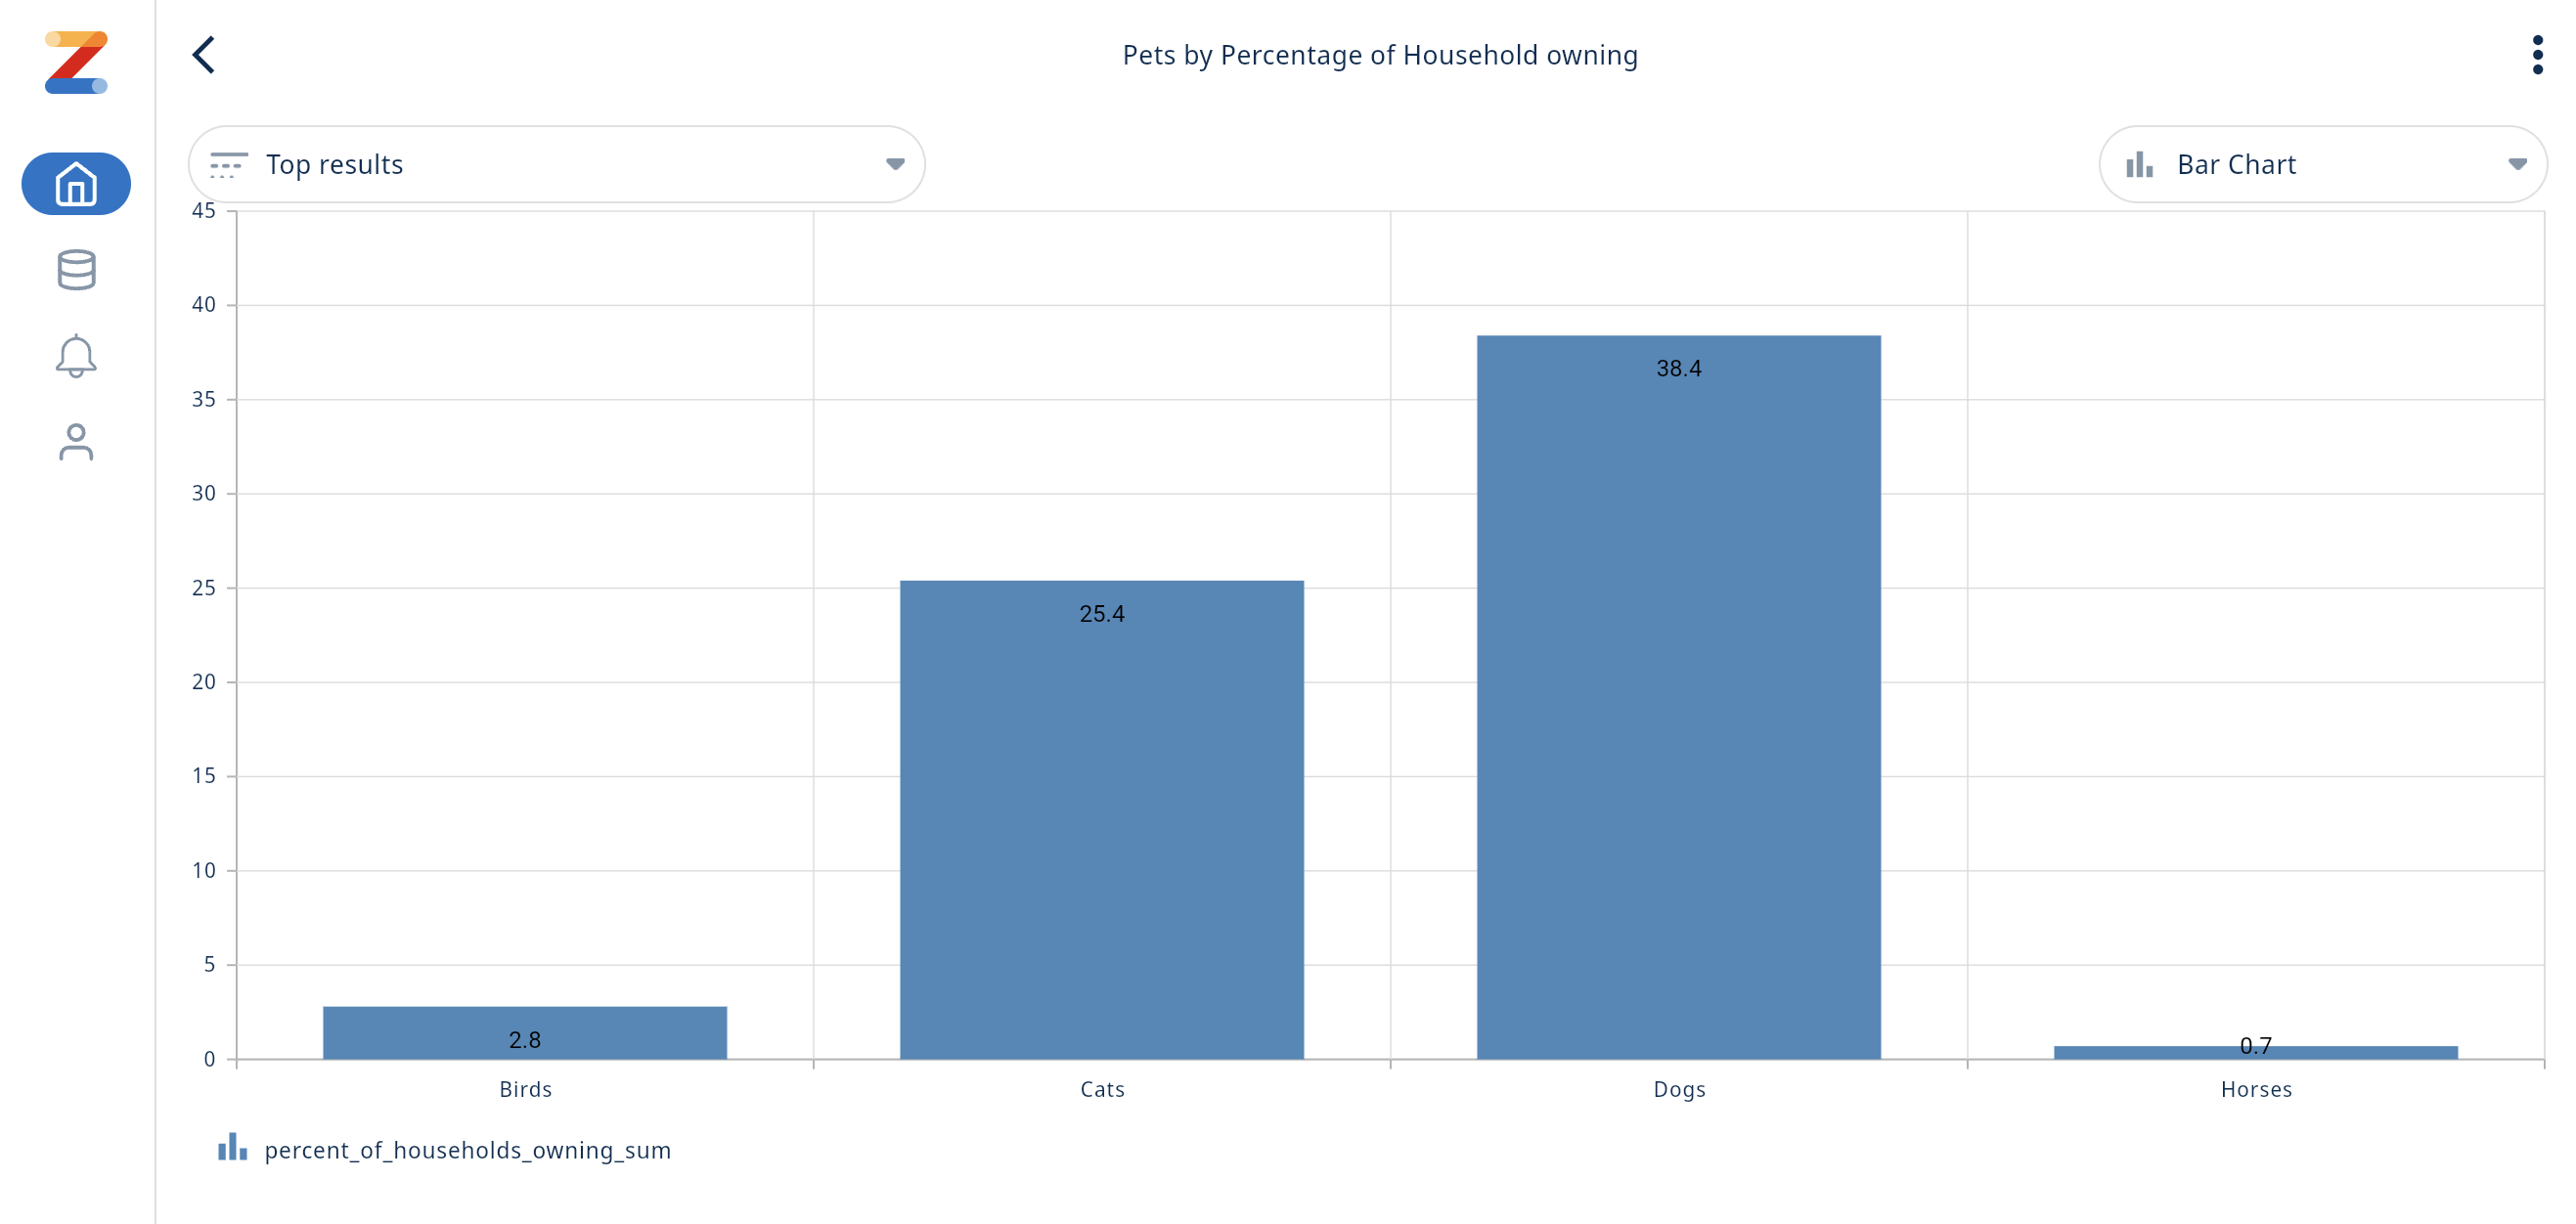
チャートの例は次のようになります。三点メニューから Question を保存できます。チャートにコメントしたり、チームメンバーをタグ付けしたり、リアルタイムアラートを作成したり、チャートタイプを変更したりできます。
-
ダッシュボードは、ホーム画面の Dashboards 配下にある「+」アイコンから作成できます。既存の Question をドラッグして、ダッシュボード上に表示させることができます。


