> ## Documentation Index
> Fetch the complete documentation index at: https://clickhouse.com/docs/llms.txt
> Use this file to discover all available pages before exploring further.

> Apache Superset は、オープンソースのデータ探索・可視化プラットフォームです。

# Superset を ClickHouse に接続

export const ClickHouseSupportedBadge = () => {
  return <div className="ClickHouseSupportedBadge">
            <div className="ClickHouseSupportedIcon">
                <svg width="16" height="16" viewBox="0 0 16 16" fill="none" xmlns="http://www.w3.org/2000/svg">
                    <path d="M1.30762 1.39073C1.30762 1.3103 1.37465 1.22986 1.46849 1.22986H2.64824C2.72868 1.22986 2.80912 1.29689 2.80912 1.39073V14.4886C2.80912 14.5691 2.74209 14.6495 2.64824 14.6495H1.46849C1.38805 14.6495 1.30762 14.5825 1.30762 14.4886V1.39073Z" fill="currentColor" />
                    <path d="M4.2832 1.39073C4.2832 1.3103 4.35023 1.22986 4.44408 1.22986H5.62383C5.70427 1.22986 5.7847 1.29689 5.7847 1.39073V14.4886C5.7847 14.5691 5.71767 14.6495 5.62383 14.6495H4.44408C4.36364 14.6495 4.2832 14.5825 4.2832 14.4886V1.39073Z" fill="currentColor" />
                    <path d="M7.25977 1.39073C7.25977 1.3103 7.3268 1.22986 7.42064 1.22986H8.60039C8.68083 1.22986 8.76127 1.29689 8.76127 1.39073V14.4886C8.76127 14.5691 8.69423 14.6495 8.60039 14.6495H7.42064C7.3402 14.6495 7.25977 14.5825 7.25977 14.4886V1.39073Z" fill="currentColor" />
                    <path d="M10.2354 1.39073C10.2354 1.3103 10.3024 1.22986 10.3962 1.22986H11.576C11.6564 1.22986 11.7369 1.29689 11.7369 1.39073V14.4886C11.7369 14.5691 11.6698 14.6495 11.576 14.6495H10.3962C10.3158 14.6495 10.2354 14.5825 10.2354 14.4886V1.39073Z" fill="currentColor" />
                    <path d="M13.2256 6.6057C13.2256 6.52526 13.2926 6.44482 13.3865 6.44482H14.5662C14.6466 6.44482 14.7271 6.51186 14.7271 6.6057V9.27354C14.7271 9.35398 14.6601 9.43442 14.5662 9.43442H13.3865C13.306 9.43442 13.2256 9.36739 13.2256 9.27354V6.6057Z" fill="currentColor" />
                </svg>
            </div>
            ClickHouse対応
        </div>;
};

export const Image = ({img, alt, size = "lg"}) => {
  const normalizedSize = ["sm", "md", "lg"].includes(size) ? size : "lg";
  return <div className={`ch-image-${normalizedSize}`}>
      <Frame>
        <img src={img} alt={alt} />
      </Frame>
    </div>;
};

<ClickHouseSupportedBadge />

<a href="https://superset.apache.org/" target="_blank">Apache Superset</a> は、Python 製のオープンソースのデータ探索・可視化プラットフォームです。Superset は、ClickHouse が提供する Python ドライバーを使用して ClickHouse に接続します。では、その仕組みを見ていきましょう...

<div id="goal">
  ## 目標
</div>

このガイドでは、ClickHouse データベースのデータを使って Superset でダッシュボードを作成します。ダッシュボードは次のようになります。

<Image size="md" img="https://mintcdn.com/private-7c7dfe99/etDiFo_9fGSe5rMN/images/integrations/data-visualization/superset_12.webp?fit=max&auto=format&n=etDiFo_9fGSe5rMN&q=85&s=679288076599288c1852e3848bb4037e" alt="円グラフやテーブルなど複数の可視化で英国の不動産価格を表示する Superset ダッシュボード" border width="640" height="551" data-path="images/integrations/data-visualization/superset_12.webp" />

<br />

<Tip>
  **データを追加する**

  使用するデータセットがない場合は、サンプルのいずれかを追加できます。このガイドでは [UK Price Paid](/docs/ja/get-started/sample-datasets/uk-price-paid) データセットを使用しているため、それを選ぶとよいでしょう。同じドキュメントカテゴリには、ほかにもいくつかあります。
</Tip>

<Steps>
  <Step title="接続情報を準備する" id="1-gather-your-connection-details">
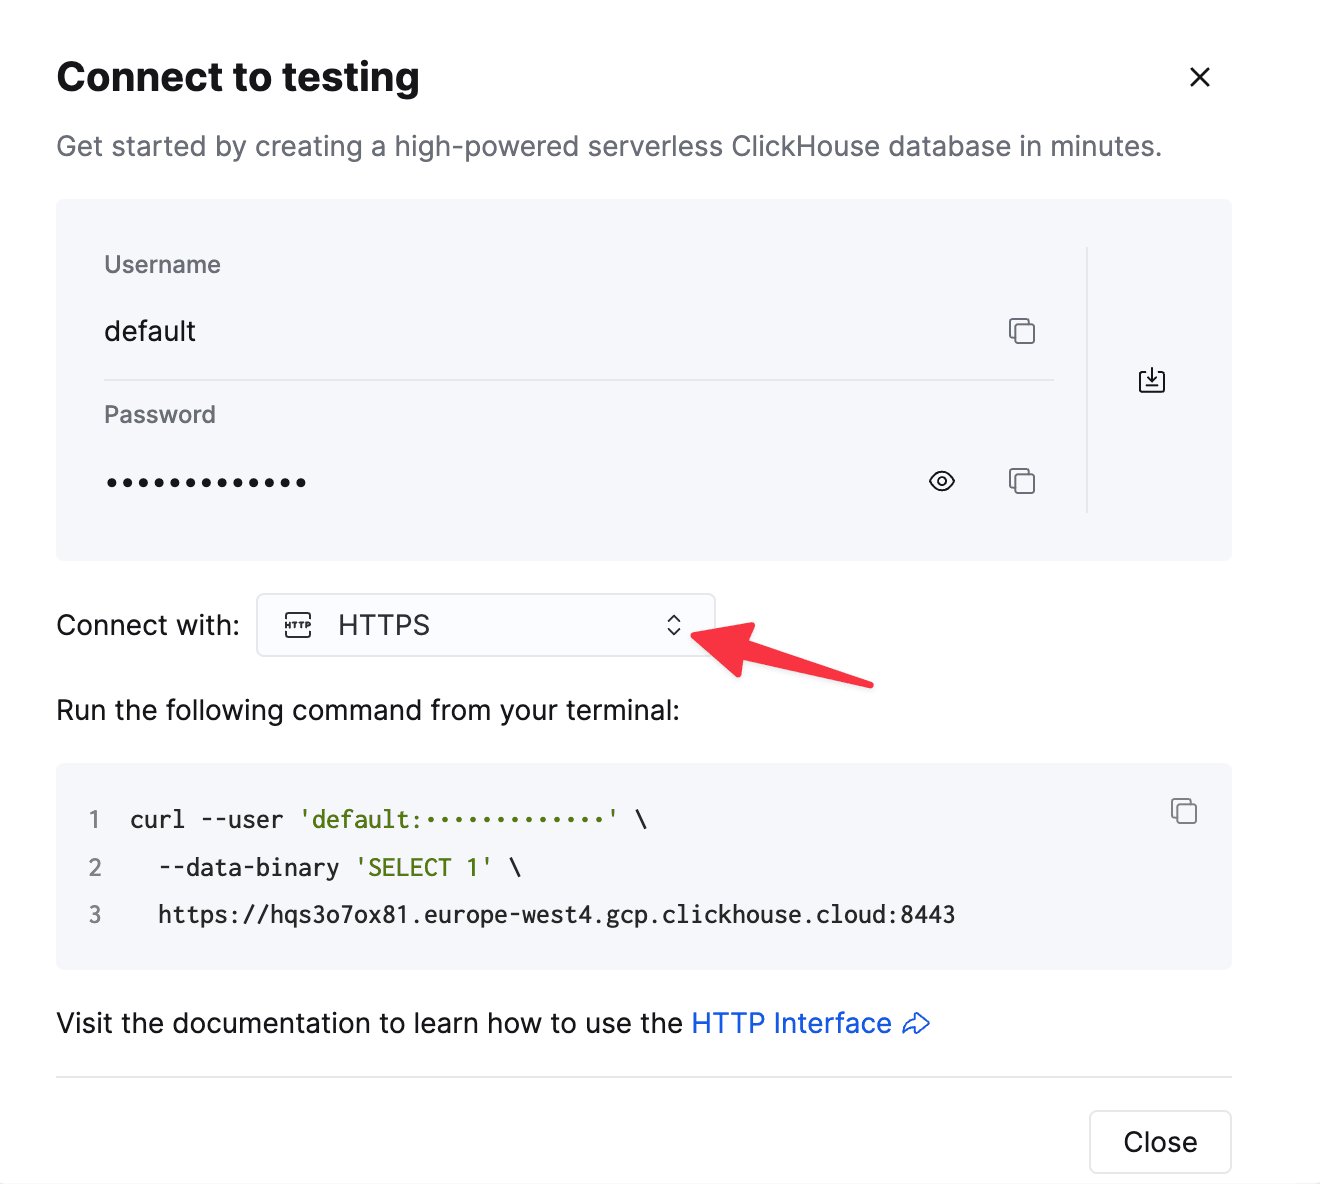
    HTTP(S) で ClickHouse に接続するには、次の情報が必要です。

    | Parameter(s)              | Description                                               |
    | ------------------------- | --------------------------------------------------------- |
    | `HOST` and `PORT`         | 通常、TLS を使用する場合のポートは 8443、TLS を使用しない場合は 8123 です。           |
    | `DATABASE NAME`           | デフォルトでは `default` という名前のデータベースがあります。接続先のデータベース名を使用してください。 |
    | `USERNAME` and `PASSWORD` | デフォルトのユーザー名は `default` です。用途に応じたユーザー名を使用してください。           |

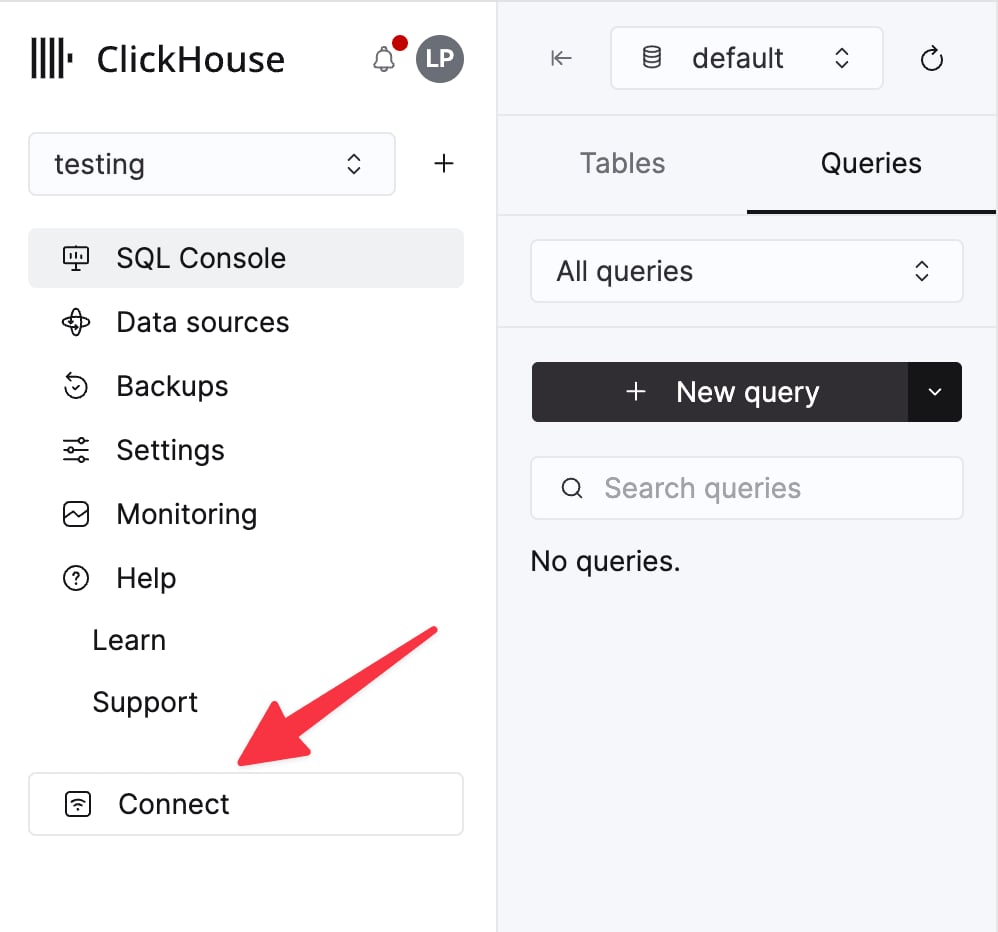
    ClickHouse Cloud サービスの詳細は、ClickHouse Cloud コンソールで確認できます。
    サービスを選択し、**Connect** をクリックします。

    <div className="ch-image-md">
      <Frame>
        <img src="https://mintcdn.com/private-7c7dfe99/CFFsa2agBPbviR4r/images/_snippets/cloud-connect-button.webp?fit=max&auto=format&n=CFFsa2agBPbviR4r&q=85&s=ec0a298a33ca841e947fa5e8bae47362" alt="ClickHouse Cloud サービスの接続ボタン" width="998" height="932" data-path="images/_snippets/cloud-connect-button.webp" />
      </Frame>
    </div>

    **HTTPS** を選択します。接続情報は `curl` コマンドの例として表示されます。

    <div className="ch-image-md">
      <Frame>
        <img src="https://mintcdn.com/private-7c7dfe99/CFFsa2agBPbviR4r/images/_snippets/connection-details-https.webp?fit=max&auto=format&n=CFFsa2agBPbviR4r&q=85&s=cb0fbd98aa2b5b7ca484c9f53395ee07" alt="ClickHouse Cloud HTTPS 接続情報" width="1320" height="1184" data-path="images/_snippets/connection-details-https.webp" />
      </Frame>
    </div>

    セルフマネージド ClickHouse を使用している場合、接続情報は ClickHouse 管理者によって設定されます。
  </Step>

  <Step title="ドライバーをインストールする" id="2-install-the-driver">
    1. Superset は `clickhouse-connect` ドライバーを使用して ClickHouse に接続します。`clickhouse-connect` の詳細は <a href="https://pypi.org/project/clickhouse-connect/" target="_blank">[https://pypi.org/project/clickhouse-connect/](https://pypi.org/project/clickhouse-connect/)</a> にあり、次のコマンドでインストールできます。

       ```console theme={null}
       pip install clickhouse-connect
       ```

    <Info>
      **Docker Compose Setup**

      Docker ベースのインストールについては、コンテナーに `clickhouse-connect` を追加する手順を [Superset のデータベース設定ガイド](https://superset.apache.org/user-docs/6.0.0/configuration/databases/) で確認してください。
    </Info>

    2. Superset を起動します (または再起動します) 。
  </Step>

  <Step title="Superset を ClickHouse に接続する" id="3-connect-superset-to-clickhouse">
    1. Superset で、上部メニューから **Data** を選択し、続いてドロップダウンメニューから **Databases** を選択します。**+ Database** ボタンをクリックして、新しいデータベースを追加します。

    <Image size="lg" img="https://mintcdn.com/private-7c7dfe99/etDiFo_9fGSe5rMN/images/integrations/data-visualization/superset_01.webp?fit=max&auto=format&n=etDiFo_9fGSe5rMN&q=85&s=4eec14a85a54563cdbb20676610ceeed" alt="Database メニューが表示され、+ Database ボタンが強調表示された Superset のインターフェイス" border width="1572" height="243" data-path="images/integrations/data-visualization/superset_01.webp" />

    <br />

    2. 最初のステップで、データベースの種類として **ClickHouse Connect** を選択します。

    <Image size="sm" img="https://mintcdn.com/private-7c7dfe99/etDiFo_9fGSe5rMN/images/integrations/data-visualization/superset_02.webp?fit=max&auto=format&n=etDiFo_9fGSe5rMN&q=85&s=e4b7b80fe77e598e2cd8d8b327375f44" alt="ClickHouse Connect オプションが選択された Superset のデータベース接続ウィザード" border width="622" height="920" data-path="images/integrations/data-visualization/superset_02.webp" />

    <br />

    3. 2 番目のステップでは、次の設定を行います。

    * SSL をオンまたはオフに設定します。
    * 先ほど収集した接続情報を入力します。
    * **DISPLAY NAME** を指定します。名前は任意ですが、複数の ClickHouse データベースに接続する場合は、わかりやすい名前にしてください。

    <Image size="sm" img="https://mintcdn.com/private-7c7dfe99/etDiFo_9fGSe5rMN/images/integrations/data-visualization/superset_03.webp?fit=max&auto=format&n=etDiFo_9fGSe5rMN&q=85&s=e9a3e57aa8330a2d8a949c67d8d46206" alt="ClickHouse 接続パラメーターが表示された Superset の接続設定フォーム" border width="499" height="838" data-path="images/integrations/data-visualization/superset_03.webp" />

    <br />

    4. **CONNECT** をクリックし、続いて **FINISH** ボタンをクリックしてセットアップウィザードを完了します。完了すると、データベースの一覧に追加したデータベースが表示されます。
  </Step>

  <Step title="データセットを追加" id="4-add-a-dataset">
    1. Superset で ClickHouse のデータを扱うには、***データセット*** を定義する必要があります。Superset の上部メニューで **Data** を選択し、次にドロップダウンメニューから **Datasets** を選択します。

    2. データセットを追加するボタンをクリックします。新しいデータベースをデータソースとして選択すると、そのデータベースで定義されているテーブルが表示されます。

    <Image size="sm" img="https://mintcdn.com/private-7c7dfe99/etDiFo_9fGSe5rMN/images/integrations/data-visualization/superset_04.webp?fit=max&auto=format&n=etDiFo_9fGSe5rMN&q=85&s=fccbd7aeab8b516c2ab804f2095a6f59" alt="ClickHouse データベースで利用可能なテーブルが表示された Superset のデータセット作成ダイアログ" border width="412" height="323" data-path="images/integrations/data-visualization/superset_04.webp" />

    <br />

    3. ダイアログウィンドウの下部にある **ADD** ボタンをクリックすると、テーブルがデータセットの一覧に表示されます。これでダッシュボードを作成し、ClickHouse のデータを分析する準備は完了です！
  </Step>

  <Step title="Superset でチャートとダッシュボードを作成する" id="5--creating-charts-and-a-dashboard-in-superset">
    Superset に慣れているなら、この次のセクションもすぐに理解できるはずです。Superset を初めて使う場合でも、まあ……世の中にある多くの優れた可視化ツールと同じです。使い始めるのは簡単ですが、細かな違いやコツは、実際に使いながら少しずつ身についていきます。

    1. まずはダッシュボードから始めます。Superset の上部メニューで **Dashboards** を選択します。右上のボタンをクリックして、新しいダッシュボードを追加します。以下のダッシュボード名は **UK property prices** です。

    <Image size="md" img="https://mintcdn.com/private-7c7dfe99/etDiFo_9fGSe5rMN/images/integrations/data-visualization/superset_05.webp?fit=max&auto=format&n=etDiFo_9fGSe5rMN&q=85&s=c78c472da68986e3038ae35aadfcb4ee" alt="チャートを追加できる状態の、UK property prices という名前の空の Superset ダッシュボード" border width="959" height="445" data-path="images/integrations/data-visualization/superset_05.webp" />

    <br />

    2. 新しいチャートを作成するには、上部メニューから **Charts** を選択し、新しいチャートを追加するボタンをクリックします。多数のオプションが表示されます。次の例では、**CHOOSE A DATASET** ドロップダウンから **uk\_price\_paid** データセットを選び、**Pie Chart** チャートを使用しています。

    <Image size="md" img="https://mintcdn.com/private-7c7dfe99/etDiFo_9fGSe5rMN/images/integrations/data-visualization/superset_06.webp?fit=max&auto=format&n=etDiFo_9fGSe5rMN&q=85&s=a75ae3e391a146023ba46f2f3fcc2527" alt="Pie Chart の可視化タイプが選択された Superset のチャート作成インターフェイス" border width="1098" height="998" data-path="images/integrations/data-visualization/superset_06.webp" />

    <br />

    3. Superset の円グラフでは **Dimension** と **Metric** が必要で、それ以外の設定は任意です。Dimension と Metric には任意のフィールドを選べます。この例では、ClickHouse のフィールド `district` を Dimension、`AVG(price)` を Metric としています。

    <Image size="md" img="https://mintcdn.com/private-7c7dfe99/etDiFo_9fGSe5rMN/images/integrations/data-visualization/superset_08.webp?fit=max&auto=format&n=etDiFo_9fGSe5rMN&q=85&s=8904d36cde3ff39ddac578257817eed5" alt="円グラフ用に district フィールドが選択された Dimension 設定" border width="657" height="633" data-path="images/integrations/data-visualization/superset_08.webp" />

    <Image size="md" img="https://mintcdn.com/private-7c7dfe99/etDiFo_9fGSe5rMN/images/integrations/data-visualization/superset_09.webp?fit=max&auto=format&n=etDiFo_9fGSe5rMN&q=85&s=e846384c93bb111a9e658f3d734486a3" alt="円グラフ用の AVG(price) aggregate function が表示された Metric 設定" border width="657" height="605" data-path="images/integrations/data-visualization/superset_09.webp" />

    <br />

    5. 円グラフではなくドーナツチャートにしたい場合は、**CUSTOMIZE** でそのほかのオプションとあわせて設定できます。

    <Image size="sm" img="https://mintcdn.com/private-7c7dfe99/etDiFo_9fGSe5rMN/images/integrations/data-visualization/superset_10.webp?fit=max&auto=format&n=etDiFo_9fGSe5rMN&q=85&s=0568cde0a54513227d9ade0d6958bda5" alt="ドーナツチャートのオプションとそのほかの円グラフ設定が表示された Customize パネル" border width="320" height="929" data-path="images/integrations/data-visualization/superset_10.webp" />

    <br />

    6. **SAVE** ボタンをクリックしてチャートを保存し、次に **ADD TO DASHBOARD** ドロップダウンで **UK property prices** を選択します。その後、**SAVE & GO TO DASHBOARD** をクリックすると、チャートが保存され、ダッシュボードに追加されます。

    <Image size="md" img="https://mintcdn.com/private-7c7dfe99/etDiFo_9fGSe5rMN/images/integrations/data-visualization/superset_11.webp?fit=max&auto=format&n=etDiFo_9fGSe5rMN&q=85&s=ccca62277d5c0c6899ec2a8933d4f8ae" alt="ダッシュボード選択用ドロップダウンと Save & Go to Dashboard ボタンが表示されたチャート保存ダイアログ" border width="1442" height="792" data-path="images/integrations/data-visualization/superset_11.webp" />

    <br />

    7. 以上です。ClickHouse のデータを基に Superset でダッシュボードを構築すれば、超高速なデータ分析の世界が大きく広がります。
    <Image size="md" img="https://mintcdn.com/private-7c7dfe99/etDiFo_9fGSe5rMN/images/integrations/data-visualization/superset_12.webp?fit=max&auto=format&n=etDiFo_9fGSe5rMN&q=85&s=679288076599288c1852e3848bb4037e" alt="ClickHouse の英国不動産価格データを複数の可視化で表示した完成済みの Superset ダッシュボード" border width="640" height="551" data-path="images/integrations/data-visualization/superset_12.webp" />

    <br />
  </Step>
</Steps>