> ## Documentation Index
> Fetch the complete documentation index at: https://clickhouse.com/docs/llms.txt
> Use this file to discover all available pages before exploring further.
> Connect ProbeDeck on iOS or iPadOS to ClickHouse Cloud or a self-hosted ClickHouse server.
# Connect ProbeDeck to ClickHouse
export const CommunityMaintainedBadge = () => {
return ;
};
export const Image = ({img, alt, size = "lg"}) => {
const normalizedSize = ["sm", "md", "lg"].includes(size) ? size : "lg";
return ;
};
ProbeDeck is an iOS and iPadOS client for checking the health of a ClickHouse server, inspecting
the `system` tables, and running SQL. It connects to the ClickHouse HTTP interface over the device
network or through an SSH bastion; it doesn't require a relay server.
Before you begin
* Install [ProbeDeck from the App Store](https://apps.apple.com/app/id6791261174).
* Use iOS or iPadOS 17.0 or later.
* Allow the device to reach the ClickHouse HTTP or HTTPS endpoint over its network, a VPN, or an
SSH bastion.
* Create a ClickHouse user with access to the databases you want to query.
* Grant the user `SELECT` access to the relevant `system` tables for monitoring.
| ProbeDeck | ClickHouse Cloud | Self-hosted ClickHouse | Notes |
| -------------- | ---------------- | -------------------------------- | -------------------------------------------------------------------------------------------------------------------------- |
| 1.1.7 or later | Current service | No pinned minimum server version | Uses the HTTP(S) interface. Test the connection and verify each monitoring section against your server version and grants. |
Some monitoring sections depend on optional log tables or newer system tables. For example,
`system.server_settings`, which ProbeDeck uses for the configured memory limit, requires ClickHouse
23.3 or later. ProbeDeck marks an affected section as limited when its source is unavailable.
How it works
1. ProbeDeck sends SQL requests to the ClickHouse HTTP(S) endpoint.
2. It reads monitoring data from `system` tables with the configured ClickHouse user.
3. The app shows query results and monitoring views on the device. An SSH bastion can carry the
same HTTP(S) connection when the endpoint has no direct route from the device.
Connect to ClickHouse Cloud
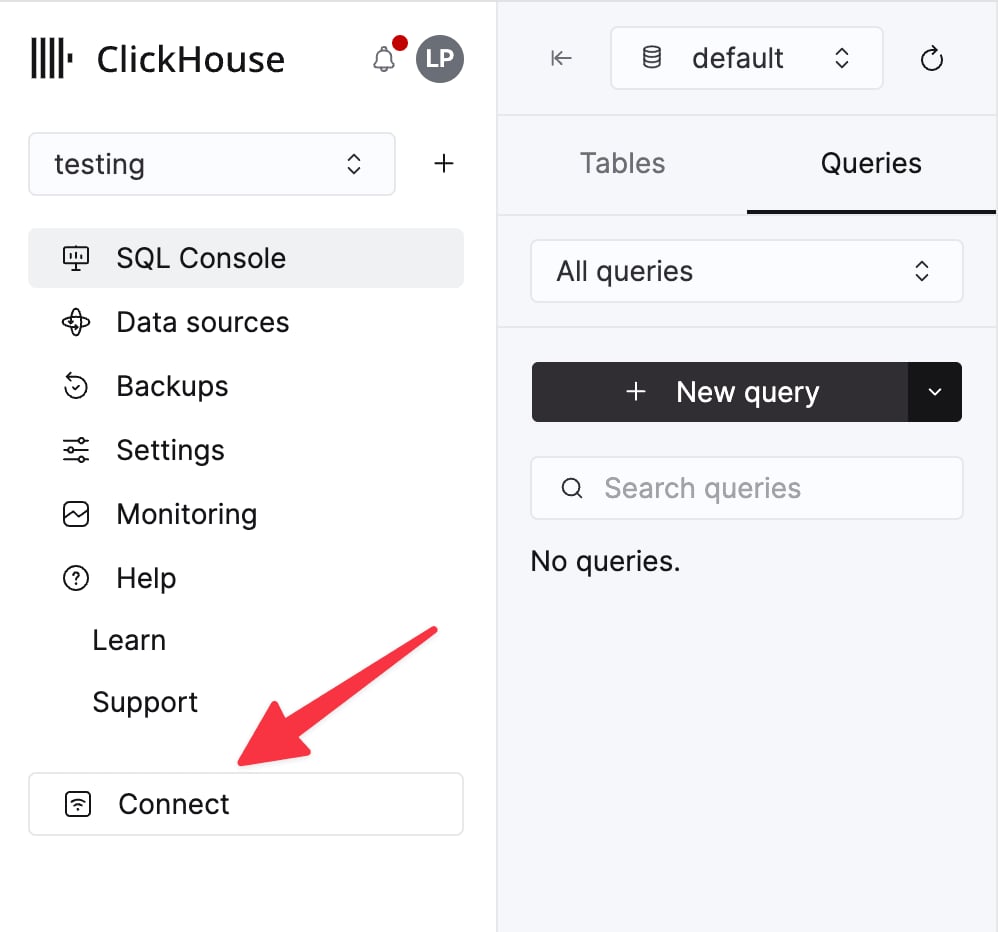
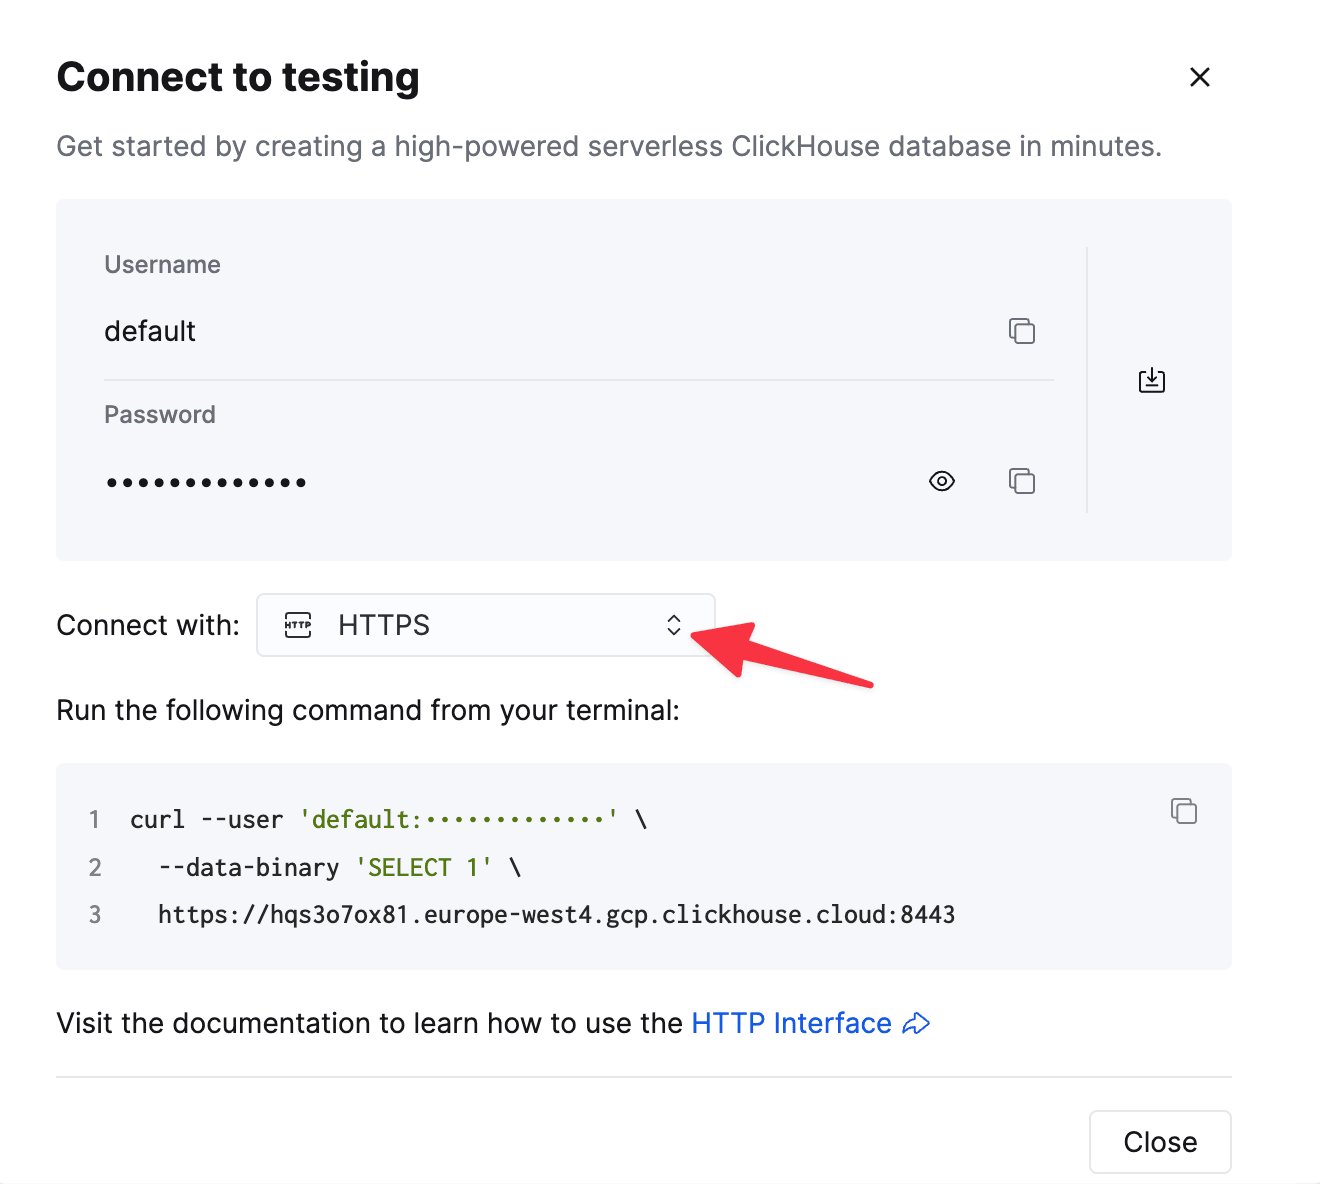
In the ClickHouse Cloud console, open your service, select **Connect**, and choose **HTTPS**.
To connect to ClickHouse with HTTP(S) you need this information:
| Parameter(s) | Description |
| ------------------------- | -------------------------------------------------------------------------------------------------------------- |
| `HOST` and `PORT` | Typically, the port is 8443 when using TLS or 8123 when not using TLS. |
| `DATABASE NAME` | Out of the box, there is a database named `default`, use the name of the database that you want to connect to. |
| `USERNAME` and `PASSWORD` | Out of the box, the username is `default`. Use the username appropriate for your use case. |
The details for your ClickHouse Cloud service are available in the ClickHouse Cloud console.
Select a service and click **Connect**:
Choose **HTTPS**. Connection details are displayed in an example `curl` command.
If you're using self-managed ClickHouse, the connection details are set by your ClickHouse administrator.
1. On the **Connections** screen, tap **+**.
2. Enter a connection name and the host without `https://`.
3. Set **Port** to `8443` and turn on **TLS**.
4. Enter the database username and password from the **Connect** dialog. The database name is
optional.
5. Tap **Test Connection**. ProbeDeck shows the server version and round-trip time after a
successful check.
6. Tap **Save**.
ProbeDeck authenticates SQL requests to the service endpoint with these database credentials.
ClickHouse Cloud uses organization-level keys from the **API Keys** page for the Cloud API and
Query API endpoints. ProbeDeck's SQL connection flow does not use those keys.
Connect to self-hosted ClickHouse
Use port `8123` for the default unencrypted HTTP interface. For HTTPS, turn on **TLS** and use the
port configured on your server; `8443` is a common choice.
Ports `9000` and `9440` belong to the native ClickHouse protocol. ProbeDeck uses the HTTP(S)
interface, so enter the server's HTTP port.
1. On the **Connections** screen, tap **+**.
2. Enter the server host without a URL scheme.
3. Set the HTTP(S) port and TLS option.
4. Enter the ClickHouse username, password, and optional database.
5. Tap **Test Connection**, then **Save**.
For a server on the local network, iOS may ask for Local Network permission. Connect the device to
its VPN first when the endpoint is reachable only from a corporate network.
Connect through an SSH bastion
Turn on **SSH Tunnel** in the connection form and enter:
1. The bastion host and SSH port (`22` by default).
2. The SSH username.
3. Either an SSH password or a private key.
ProbeDeck opens an SSH `direct-tcpip` channel from the bastion to the ClickHouse host and HTTP(S)
port in the **Server** section. On the first connection, compare the bastion's SHA-256 host-key
fingerprint with a value from the server administrator before accepting it.
ProbeDeck sends the database username and password in the `X-ClickHouse-User` and
`X-ClickHouse-Key` request headers. It doesn't put credentials in the URL.
For mutual TLS, turn on **TLS Client Certificate** and import a PKCS#12 (`.p12`) file that contains
the client certificate and private key, then enter its passphrase.
When a self-hosted endpoint presents a self-signed certificate or a certificate from a private
CA, ProbeDeck shows its SHA-256 fingerprint, issuer, subject, and validity period. Compare the
fingerprint with the value from the server administrator before accepting it. ProbeDeck pins the
decision to that connection; a certificate change stops the connection until you review it.
ProbeDeck stores connection secrets and imported key material in the iOS Keychain on the device.
Monitor ClickHouse
Open the saved connection and select **Monitor**. The dashboard summarizes these sources:
| Area | ClickHouse source |
| ---------------------------------------------------- | ------------------------------------------------------------------------- |
| Running queries, elapsed time, memory, and rows read | `system.processes` |
| Replication state and queue | `system.replicas`, `system.replication_queue` |
| Disks, parts, and merges | `system.disks`, `system.parts`, `system.merges` |
| Mutations | `system.mutations` |
| Memory and server metrics | `system.metrics`, `system.asynchronous_metrics`, `system.server_settings` |
| Historical query and disk rates | `system.metric_log`, `system.asynchronous_metric_log` |
Tap **Running queries** to sort active queries by elapsed time and inspect memory and rows read.
Query the UK property price dataset
This example uses the [UK property price dataset](/docs/get-started/sample-datasets/uk-price-paid).
Load the dataset into `uk_price_paid`, then:
1. Open the connection and select **Data**.
2. Open the SQL editor.
3. Run this bounded, read-only query:
```sql theme={null}
SELECT
town,
count() AS sales,
round(avg(price)) AS average_price
FROM uk_price_paid
GROUP BY town
ORDER BY sales DESC
LIMIT 10
```
The result should contain ten towns with their transaction counts and average prices.
Known limits
* ProbeDeck runs on iOS and iPadOS 17.0 or later.
* Free users can save one connection at a time. Deleting it frees the slot; ProbeDeck Pro allows
unlimited saved connections.
* It supports the ClickHouse HTTP(S) interface, not the native protocol.
* ProbeDeck loads SQL results in pages of 200 rows and caps each request at 10,000 rows. Use a
selective `WHERE` clause and `LIMIT` for large tables.
* Monitoring visibility depends on the ClickHouse user's grants and on optional log tables.
* The device needs a route to the endpoint over its network, a VPN, or the built-in SSH tunnel.
* Monitoring and read-only SQL do not require an in-app purchase. `KILL QUERY`, `KILL MUTATION`,
write and DDL statements, and other operational actions require ProbeDeck Pro.
Troubleshooting
Copy the database username and password again. For the ClickHouse Cloud service endpoint, use the
database credentials from the service's **Connect** dialog. Do not substitute an organization-level
key from the ClickHouse Cloud **API Keys** page.
Confirm that the device can reach the host and HTTP(S) port. Check the Cloud IP access list, VPN,
firewall, and port mapping. Don't use the native protocol ports `9000` or `9440`.
The ClickHouse user can't read one or more required `system` tables. Ask the server administrator
for the minimum `SELECT` grants required for the monitoring areas you intend to use, then reconnect.
Ask the server administrator to confirm the certificate rotation before accepting the new
fingerprint. An unexpected change can indicate a different endpoint or TLS interception path.
Next steps
* See the [ProbeDeck website](https://probedeck.app) for product-specific details.
* See the [ClickHouse HTTP interface documentation](/docs/interfaces/http) for server configuration.