> ## Documentation Index
> Fetch the complete documentation index at: https://clickhouse.com/docs/llms.txt
> Use this file to discover all available pages before exploring further.

> Explo is an easy-to-use, open source UI tool for asking questions about your data.

# Connecting Explo to ClickHouse

export const CommunityMaintainedBadge = () => {
  return <div className="CommunityMaintainedBadge">
            <div className="CommunityMaintainedIcon">
            <svg xmlns="http://www.w3.org/2000/svg" width="20" height="20" fill="currentColor" viewBox="0 0 256 256">
                <path d="M244.8,150.4a8,8,0,0,1-11.2-1.6A51.6,51.6,0,0,0,192,128a8,8,0,0,1-7.37-4.89,8,8,0,0,1,0-6.22A8,8,0,0,1,192,112a24,24,0,1,0-23.24-30,8,8,0,1,1-15.5-4A40,40,0,1,1,219,117.51a67.94,67.94,0,0,1,27.43,21.68A8,8,0,0,1,244.8,150.4ZM190.92,212a8,8,0,1,1-13.84,8,57,57,0,0,0-98.16,0,8,8,0,1,1-13.84-8,72.06,72.06,0,0,1,33.74-29.92,48,48,0,1,1,58.36,0A72.06,72.06,0,0,1,190.92,212ZM128,176a32,32,0,1,0-32-32A32,32,0,0,0,128,176ZM72,120a8,8,0,0,0-8-8A24,24,0,1,1,87.24,82a8,8,0,1,0,15.5-4A40,40,0,1,0,37,117.51,67.94,67.94,0,0,0,9.6,139.19a8,8,0,1,0,12.8,9.61A51.6,51.6,0,0,1,64,128,8,8,0,0,0,72,120Z"></path>
            </svg>
        </div>
            Community Maintained
        </div>;
};

export const Image = ({img, alt, size = "lg"}) => {
  const normalizedSize = ["sm", "md", "lg"].includes(size) ? size : "lg";
  return <div className={`ch-image-${normalizedSize}`}>
      <Frame>
        <img src={img} alt={alt} />
      </Frame>
    </div>;
};

<CommunityMaintainedBadge />

Customer-facing analytics for any platform. Designed for beautiful visualization. Engineered for simplicity.

<h2 id="goal">
  Goal
</h2>

In this guide you will connect your data from ClickHouse to Explo and visualize the results.  The chart will look like this:

<Image img="https://mintcdn.com/private-7c7dfe99/PWQnWTwcu17exYX2/images/integrations/data-visualization/explo_15.webp?fit=max&auto=format&n=PWQnWTwcu17exYX2&q=85&s=2990776443cdf84538dfa5d37ae2de66" size="md" alt="Explo Dashboard" width="1152" height="661" data-path="images/integrations/data-visualization/explo_15.webp" />

<p />

<Tip>
  **Add some data**

  If you don't have a dataset to work with you can add one of the examples.  This guide uses the [UK Price Paid](/docs/get-started/sample-datasets/uk-price-paid) dataset, so you might choose that one.  There are several others to look at in the same documentation category.
</Tip>

<Steps>
  <Step title="Gather your connection details" id="1-gather-your-connection-details">
    To connect to ClickHouse with HTTP(S) you need this information:

    | Parameter(s)              | Description                                                                                                    |
    | ------------------------- | -------------------------------------------------------------------------------------------------------------- |
    | `HOST` and `PORT`         | Typically, the port is 8443 when using TLS or 8123 when not using TLS.                                         |
    | `DATABASE NAME`           | Out of the box, there is a database named `default`, use the name of the database that you want to connect to. |
    | `USERNAME` and `PASSWORD` | Out of the box, the username is `default`. Use the username appropriate for your use case.                     |

    The details for your ClickHouse Cloud service are available in the ClickHouse Cloud console.
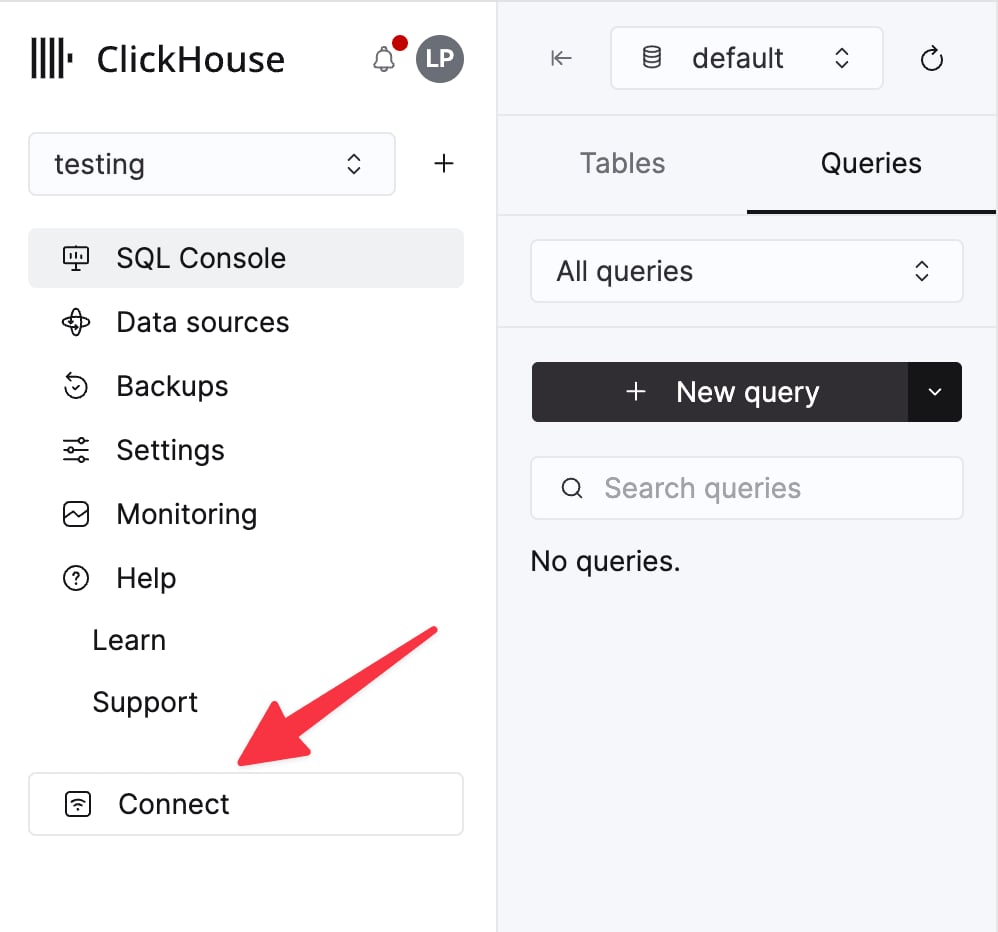
    Select a service and click **Connect**:

    <div className="ch-image-md">
      <Frame>
        <img src="https://mintcdn.com/private-7c7dfe99/CFFsa2agBPbviR4r/images/_snippets/cloud-connect-button.webp?fit=max&auto=format&n=CFFsa2agBPbviR4r&q=85&s=ec0a298a33ca841e947fa5e8bae47362" alt="ClickHouse Cloud service connect button" width="998" height="932" data-path="images/_snippets/cloud-connect-button.webp" />
      </Frame>
    </div>

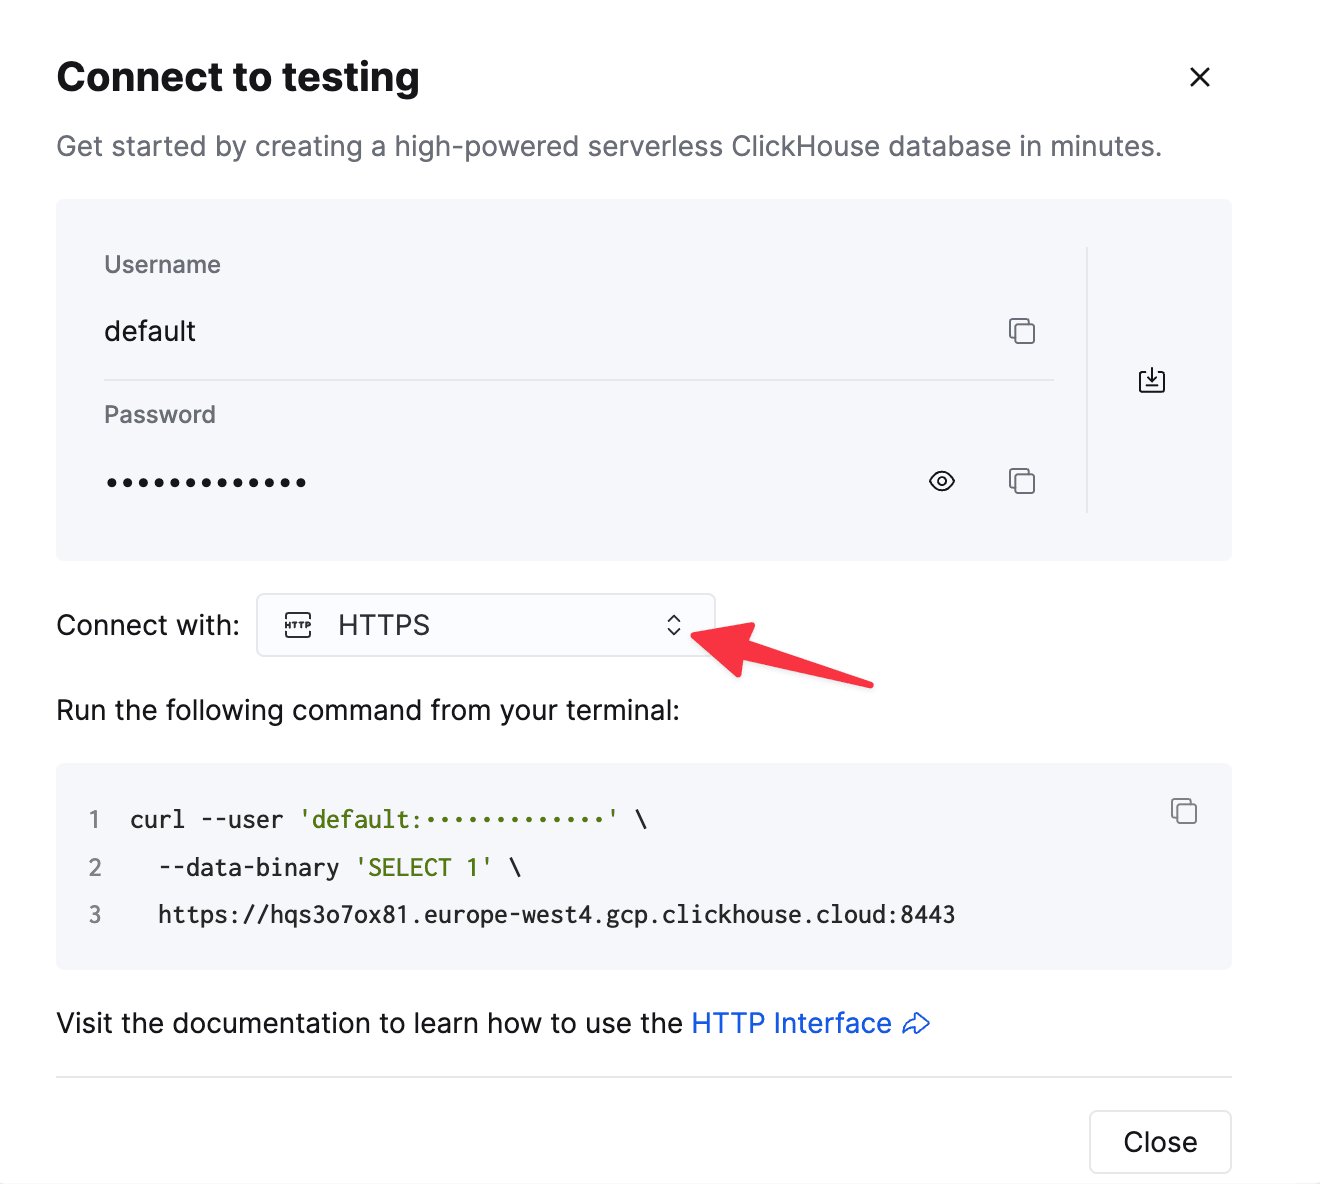
    Choose **HTTPS**. Connection details are displayed in an example `curl` command.

    <div className="ch-image-md">
      <Frame>
        <img src="https://mintcdn.com/private-7c7dfe99/CFFsa2agBPbviR4r/images/_snippets/connection-details-https.webp?fit=max&auto=format&n=CFFsa2agBPbviR4r&q=85&s=cb0fbd98aa2b5b7ca484c9f53395ee07" alt="ClickHouse Cloud HTTPS connection details" width="1320" height="1184" data-path="images/_snippets/connection-details-https.webp" />
      </Frame>
    </div>

    If you're using self-managed ClickHouse, the connection details are set by your ClickHouse administrator.
  </Step>

  <Step title="Connect Explo to ClickHouse" id="2--connect-explo-to-clickhouse">
    1. Sign up for an Explo account.

    2. Click on the Explo **data** tab on the left hand sidebar.

    <Image img="https://mintcdn.com/private-7c7dfe99/PWQnWTwcu17exYX2/images/integrations/data-visualization/explo_01.webp?fit=max&auto=format&n=PWQnWTwcu17exYX2&q=85&s=e6b224c4e839e5a9e57e600304f48916" size="sm" alt="Data Tab" border width="432" height="500" data-path="images/integrations/data-visualization/explo_01.webp" />

    3. Click **Connect Data Source** in the upper right hand side.

    <Image img="https://mintcdn.com/private-7c7dfe99/PWQnWTwcu17exYX2/images/integrations/data-visualization/explo_02.webp?fit=max&auto=format&n=PWQnWTwcu17exYX2&q=85&s=a97279c9282e37c2c10b1857916623a4" size="sm" alt="Connect Data Source" border width="288" height="78" data-path="images/integrations/data-visualization/explo_02.webp" />

    4. Fill out the information on the **Getting Started** page

    <Image img="https://mintcdn.com/private-7c7dfe99/PWQnWTwcu17exYX2/images/integrations/data-visualization/explo_03.webp?fit=max&auto=format&n=PWQnWTwcu17exYX2&q=85&s=4d5ae2e1a38109268e4cc07f75a819d1" size="md" alt="Getting Started" border width="1152" height="894" data-path="images/integrations/data-visualization/explo_03.webp" />

    5. Select **Clickhouse**

    <Image img="https://mintcdn.com/private-7c7dfe99/PWQnWTwcu17exYX2/images/integrations/data-visualization/explo_04.webp?fit=max&auto=format&n=PWQnWTwcu17exYX2&q=85&s=c8dd70cee272bcaa924c9855e684c21b" size="md" alt="Clickhouse" border width="1152" height="1156" data-path="images/integrations/data-visualization/explo_04.webp" />

    6. Enter your **Clickhouse Credentials**.

    <Image img="https://mintcdn.com/private-7c7dfe99/PWQnWTwcu17exYX2/images/integrations/data-visualization/explo_05.webp?fit=max&auto=format&n=PWQnWTwcu17exYX2&q=85&s=90b3558cbf0ac21438da4c66ee247c66" size="md" alt="Credentials" border width="1152" height="902" data-path="images/integrations/data-visualization/explo_05.webp" />

    7. Configure **Security**

    <Image img="https://mintcdn.com/private-7c7dfe99/PWQnWTwcu17exYX2/images/integrations/data-visualization/explo_06.webp?fit=max&auto=format&n=PWQnWTwcu17exYX2&q=85&s=076d67c9575c7ba733156b5406c3c6b8" size="md" alt="Security" border width="1152" height="855" data-path="images/integrations/data-visualization/explo_06.webp" />

    8. Within Clickhouse, **Whitelist the Explo IPs**.
       `54.211.43.19, 52.55.98.121, 3.214.169.94, and 54.156.141.148`
  </Step>

  <Step title="Create a Dashboard" id="3-create-a-dashboard">
    1. Navigate to **Dashboard** tab on the left side nav bar.

    <Image img="https://mintcdn.com/private-7c7dfe99/PWQnWTwcu17exYX2/images/integrations/data-visualization/explo_07.webp?fit=max&auto=format&n=PWQnWTwcu17exYX2&q=85&s=bedca9b3c0bc41d7a7fd887dfd85a4e2" size="sm" alt="Dashboard" border width="432" height="891" data-path="images/integrations/data-visualization/explo_07.webp" />

    2. Click **Create Dashboard** in the upper right corner and name your dashboard. You've now created a dashboard!

    <Image img="https://mintcdn.com/private-7c7dfe99/PWQnWTwcu17exYX2/images/integrations/data-visualization/explo_08.webp?fit=max&auto=format&n=PWQnWTwcu17exYX2&q=85&s=65a5fc374f54ee62d67030d04c8103e2" size="sm" alt="Create Dashboard" border width="425" height="76" data-path="images/integrations/data-visualization/explo_08.webp" />

    3. You should now see a screen that is similar to this:

    <Image img="https://mintcdn.com/private-7c7dfe99/PWQnWTwcu17exYX2/images/integrations/data-visualization/explo_09.webp?fit=max&auto=format&n=PWQnWTwcu17exYX2&q=85&s=568f050a91cfb6e6f7f1b94000c055c1" size="md" alt="Explo Dashboard" border width="1152" height="688" data-path="images/integrations/data-visualization/explo_09.webp" />
  </Step>

  <Step title="Run a SQL query" id="4-run-a-sql-query">
    1. Get your table name from the right hand sidebar under your schema title. You should then put the following command into your dataset editor:
       `SELECT * FROM YOUR_TABLE_NAME
       LIMIT 100`

    <Image img="https://mintcdn.com/private-7c7dfe99/PWQnWTwcu17exYX2/images/integrations/data-visualization/explo_10.webp?fit=max&auto=format&n=PWQnWTwcu17exYX2&q=85&s=d6fa75e995c4d3361a1018e449e59079" size="md" alt="Explo Dashboard" border width="1152" height="284" data-path="images/integrations/data-visualization/explo_10.webp" />

    2. Now click run and go to the preview tab to see your data.

    <Image img="https://mintcdn.com/private-7c7dfe99/PWQnWTwcu17exYX2/images/integrations/data-visualization/explo_11.webp?fit=max&auto=format&n=PWQnWTwcu17exYX2&q=85&s=b7f650470d5cab69c8cd519eaecc7fa1" size="md" alt="Explo Dashboard" border width="1152" height="329" data-path="images/integrations/data-visualization/explo_11.webp" />
  </Step>

  <Step title="Build a Chart" id="5-build-a-chart">
    1. From the left hand side, drag the bar chart icon onto the screen.

    <Image img="https://mintcdn.com/private-7c7dfe99/PWQnWTwcu17exYX2/images/integrations/data-visualization/explo_16.webp?fit=max&auto=format&n=PWQnWTwcu17exYX2&q=85&s=707795b023db6f39f8d00db7ce59dda1" size="sm" alt="Explo Dashboard" border width="432" height="978" data-path="images/integrations/data-visualization/explo_16.webp" />

    2. Select the dataset. You should now see a screen like the following:

    <Image img="https://mintcdn.com/private-7c7dfe99/PWQnWTwcu17exYX2/images/integrations/data-visualization/explo_12.webp?fit=max&auto=format&n=PWQnWTwcu17exYX2&q=85&s=265efc244dd0a93a5102a74eb8011806" size="sm" alt="Explo Dashboard" border width="432" height="744" data-path="images/integrations/data-visualization/explo_12.webp" />

    3. Fill out the **county** in the X Axis and **Price** in the Y Axis Section like so:

    <Image img="https://mintcdn.com/private-7c7dfe99/PWQnWTwcu17exYX2/images/integrations/data-visualization/explo_13.webp?fit=max&auto=format&n=PWQnWTwcu17exYX2&q=85&s=2e00df85a3c234b925d4e5f02e0f0ac3" size="sm" alt="Explo Dashboard" border width="432" height="754" data-path="images/integrations/data-visualization/explo_13.webp" />

    4. Now, change the aggregation to **AVG**.

    <Image img="https://mintcdn.com/private-7c7dfe99/PWQnWTwcu17exYX2/images/integrations/data-visualization/explo_14.webp?fit=max&auto=format&n=PWQnWTwcu17exYX2&q=85&s=c8cf7dc7e75c48e4d4543a344af6e7db" size="sm" alt="Explo Dashboard" border width="432" height="447" data-path="images/integrations/data-visualization/explo_14.webp" />

    5. We now have average price of homes broken down by price!

    <Image img="https://mintcdn.com/private-7c7dfe99/PWQnWTwcu17exYX2/images/integrations/data-visualization/explo_15.webp?fit=max&auto=format&n=PWQnWTwcu17exYX2&q=85&s=2990776443cdf84538dfa5d37ae2de66" size="md" alt="Explo Dashboard" width="1152" height="661" data-path="images/integrations/data-visualization/explo_15.webp" />
  </Step>
</Steps>

<h2 id="learn-more">
  Learn more
</h2>

Find more information about Explo and how to build dashboards by <a href="https://docs.explo.co/" target="_blank">visiting the Explo documentation</a>.