> ## Documentation Index
> Fetch the complete documentation index at: https://clickhouse.com/docs/llms.txt
> Use this file to discover all available pages before exploring further.

# Connecting Chartbrew to ClickHouse

> Connect Chartbrew to ClickHouse to create real-time dashboards and client reports.

export const Image = ({img, alt, size = "lg"}) => {
  const normalizedSize = ["sm", "md", "lg"].includes(size) ? size : "lg";
  return <div className={`ch-image-${normalizedSize}`}>
      <Frame>
        <img src={img} alt={alt} />
      </Frame>
    </div>;
};

export const CommunityMaintainedBadge = () => {
  return <div className="CommunityMaintainedBadge">
            <div className="CommunityMaintainedIcon">
            <svg xmlns="http://www.w3.org/2000/svg" width="20" height="20" fill="currentColor" viewBox="0 0 256 256">
                <path d="M244.8,150.4a8,8,0,0,1-11.2-1.6A51.6,51.6,0,0,0,192,128a8,8,0,0,1-7.37-4.89,8,8,0,0,1,0-6.22A8,8,0,0,1,192,112a24,24,0,1,0-23.24-30,8,8,0,1,1-15.5-4A40,40,0,1,1,219,117.51a67.94,67.94,0,0,1,27.43,21.68A8,8,0,0,1,244.8,150.4ZM190.92,212a8,8,0,1,1-13.84,8,57,57,0,0,0-98.16,0,8,8,0,1,1-13.84-8,72.06,72.06,0,0,1,33.74-29.92,48,48,0,1,1,58.36,0A72.06,72.06,0,0,1,190.92,212ZM128,176a32,32,0,1,0-32-32A32,32,0,0,0,128,176ZM72,120a8,8,0,0,0-8-8A24,24,0,1,1,87.24,82a8,8,0,1,0,15.5-4A40,40,0,1,0,37,117.51,67.94,67.94,0,0,0,9.6,139.19a8,8,0,1,0,12.8,9.61A51.6,51.6,0,0,1,64,128,8,8,0,0,0,72,120Z"></path>
            </svg>
        </div>
            Community Maintained
        </div>;
};

<CommunityMaintainedBadge />

[Chartbrew](https://chartbrew.com) is a data visualization platform that allows you to create dashboards and monitor data in real time. It supports multiple data sources, including ClickHouse, and provides a no-code interface for building charts and reports.

<h2 id="goal">
  Goal
</h2>

In this guide, you will connect Chartbrew to ClickHouse, run a SQL query, and create a visualization. By the end, your dashboard may look something like this:

<Image img="https://mintcdn.com/private-7c7dfe99/PWQnWTwcu17exYX2/images/integrations/data-visualization/chartbrew_01.webp?fit=max&auto=format&n=PWQnWTwcu17exYX2&q=85&s=7976a96696512f77018ba05775788b7b" size="lg" alt="Chartbrew dashboard" width="2400" height="1289" data-path="images/integrations/data-visualization/chartbrew_01.webp" />

<Tip>
  **Add some data**

  If you don't have a dataset to work with, you can add one of the examples. This guide uses the [UK Price Paid](/docs/get-started/sample-datasets/uk-price-paid) dataset.
</Tip>

<Steps>
  <Step title="Gather your connection details" id="1-gather-your-connection-details">
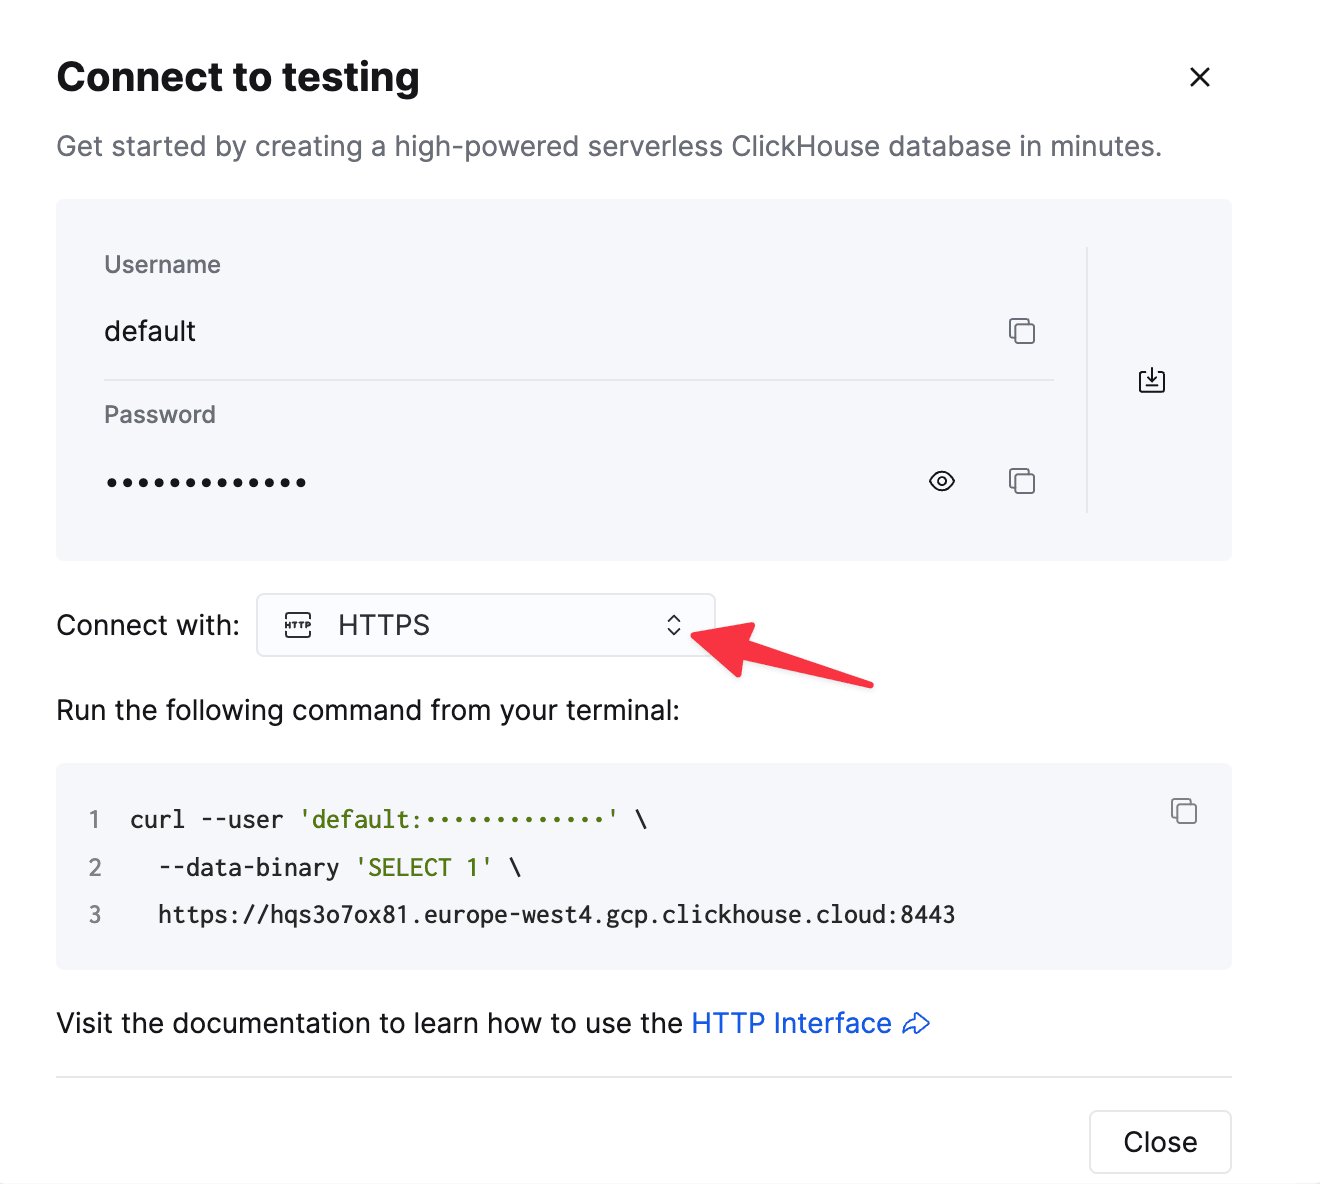
    To connect to ClickHouse with HTTP(S) you need this information:

    | Parameter(s)              | Description                                                                                                    |
    | ------------------------- | -------------------------------------------------------------------------------------------------------------- |
    | `HOST` and `PORT`         | Typically, the port is 8443 when using TLS or 8123 when not using TLS.                                         |
    | `DATABASE NAME`           | Out of the box, there is a database named `default`, use the name of the database that you want to connect to. |
    | `USERNAME` and `PASSWORD` | Out of the box, the username is `default`. Use the username appropriate for your use case.                     |

    The details for your ClickHouse Cloud service are available in the ClickHouse Cloud console.
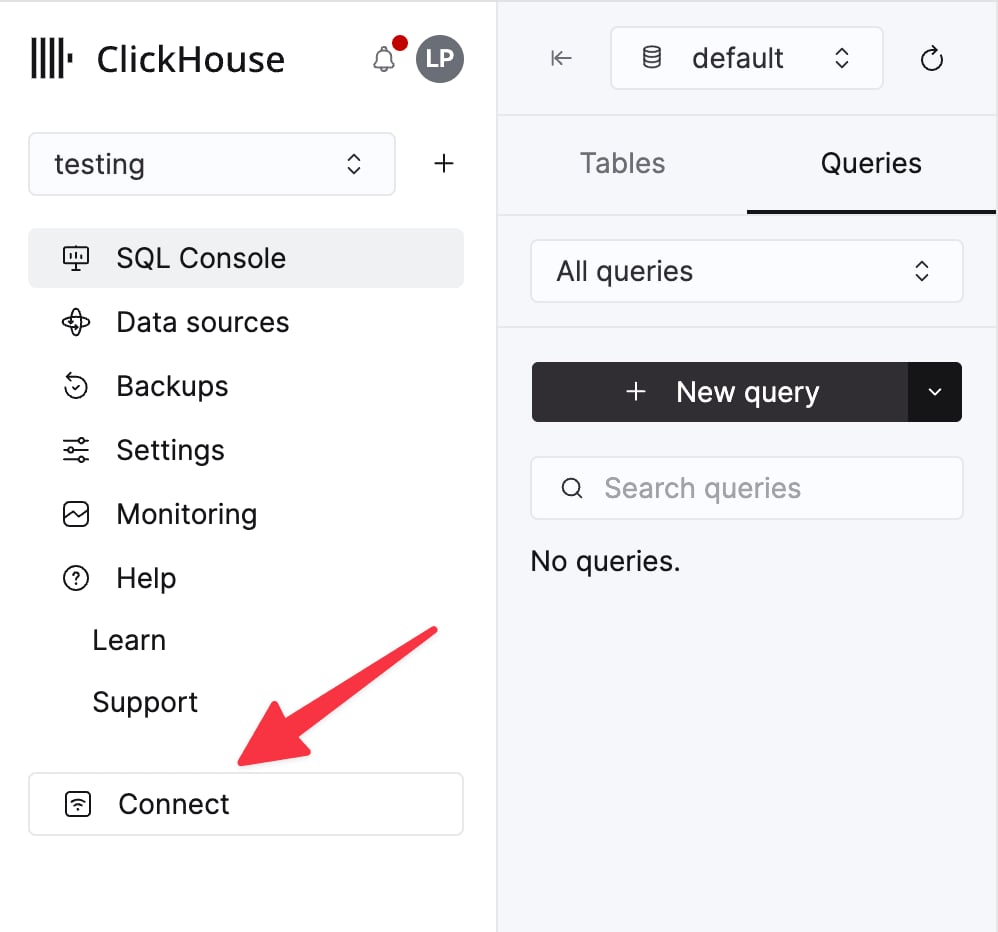
    Select a service and click **Connect**:

    <div className="ch-image-md">
      <Frame>
        <img src="https://mintcdn.com/private-7c7dfe99/CFFsa2agBPbviR4r/images/_snippets/cloud-connect-button.webp?fit=max&auto=format&n=CFFsa2agBPbviR4r&q=85&s=ec0a298a33ca841e947fa5e8bae47362" alt="ClickHouse Cloud service connect button" width="998" height="932" data-path="images/_snippets/cloud-connect-button.webp" />
      </Frame>
    </div>

    Choose **HTTPS**. Connection details are displayed in an example `curl` command.

    <div className="ch-image-md">
      <Frame>
        <img src="https://mintcdn.com/private-7c7dfe99/CFFsa2agBPbviR4r/images/_snippets/connection-details-https.webp?fit=max&auto=format&n=CFFsa2agBPbviR4r&q=85&s=cb0fbd98aa2b5b7ca484c9f53395ee07" alt="ClickHouse Cloud HTTPS connection details" width="1320" height="1184" data-path="images/_snippets/connection-details-https.webp" />
      </Frame>
    </div>

    If you're using self-managed ClickHouse, the connection details are set by your ClickHouse administrator.
  </Step>

  <Step title="Connect Chartbrew to ClickHouse" id="2-connect-chartbrew-to-clickhouse">
    1. Log in to [Chartbrew](https://chartbrew.com/login) and go to the **Connections** tab.

    2. Click **Create connection** and select **ClickHouse** from the available database options.

           <Image img="https://mintcdn.com/private-7c7dfe99/PWQnWTwcu17exYX2/images/integrations/data-visualization/chartbrew_02.webp?fit=max&auto=format&n=PWQnWTwcu17exYX2&q=85&s=4131cc42b6327105fb22d11dfcd32929" size="lg" alt="Select ClickHouse connection in Chartbrew" width="1600" height="1132" data-path="images/integrations/data-visualization/chartbrew_02.webp" />

    3. Enter the connection details for your ClickHouse database:

       * **Display Name**: A name to identify the connection in Chartbrew.
       * **Host**: The hostname or IP address of your ClickHouse server.
       * **Port**: Typically `8443` for HTTPS connections.
       * **Database Name**: The database you want to connect to.
       * **Username**: Your ClickHouse username.
       * **Password**: Your ClickHouse password.

           <Image img="https://mintcdn.com/private-7c7dfe99/PWQnWTwcu17exYX2/images/integrations/data-visualization/chartbrew_03.webp?fit=max&auto=format&n=PWQnWTwcu17exYX2&q=85&s=69925fe1dfdb2ef8377a2c46c7ca3a18" size="lg" alt="ClickHouse connection settings in Chartbrew" width="1600" height="1141" data-path="images/integrations/data-visualization/chartbrew_03.webp" />

    4. Click **Test connection** to verify that Chartbrew can connect to ClickHouse.

    5. If the test is successful, click **Save connection**. Chartbrew will automatically retrieve the schema from ClickHouse.

           <Image img="https://mintcdn.com/private-7c7dfe99/PWQnWTwcu17exYX2/images/integrations/data-visualization/chartbrew_04.webp?fit=max&auto=format&n=PWQnWTwcu17exYX2&q=85&s=8f67660c923c5227096da4c7e038db9c" size="lg" alt="ClickHouse JSON schema in Chartbrew" width="1600" height="855" data-path="images/integrations/data-visualization/chartbrew_04.webp" />
  </Step>

  <Step title="Create a dataset and run a SQL query" id="3-create-a-dataset-and-run-a-sql-query">
    1. Click on the **Create dataset** button or navigate to the **Datasets** tab to create one.
    2. Select the ClickHouse connection you created earlier.

    <Image img="https://mintcdn.com/private-7c7dfe99/PWQnWTwcu17exYX2/images/integrations/data-visualization/chartbrew_05.webp?fit=max&auto=format&n=PWQnWTwcu17exYX2&q=85&s=d064adfea3e39be056cdb16f7adf8e30" size="lg" alt="Select ClickHouse connection for dataset" width="1600" height="725" data-path="images/integrations/data-visualization/chartbrew_05.webp" />

    Write a SQL query to retrieve the data you want to visualize. For example, this query calculates the average price paid per year from the `uk_price_paid` dataset:

    ```sql theme={null}
    SELECT toYear(date) AS year, avg(price) AS avg_price
    FROM uk_price_paid
    GROUP BY year
    ORDER BY year;
    ```

    <Image img="https://mintcdn.com/private-7c7dfe99/PWQnWTwcu17exYX2/images/integrations/data-visualization/chartbrew_07.webp?fit=max&auto=format&n=PWQnWTwcu17exYX2&q=85&s=5ddd5f1ffb71a65354cb00953bfccd01" size="lg" alt="ClickHouse SQL query in Chartbrew" width="1600" height="928" data-path="images/integrations/data-visualization/chartbrew_07.webp" />

    Click **Run query** to fetch the data.

    If you're unsure how to write the query, you can use **Chartbrew's AI assistant** to generate SQL queries based on your database schema.

    <Image img="https://mintcdn.com/private-7c7dfe99/PWQnWTwcu17exYX2/images/integrations/data-visualization/chartbrew_06.webp?fit=max&auto=format&n=PWQnWTwcu17exYX2&q=85&s=bff62660b2e116aa5c642d312e3d487f" size="lg" alt="ClickHouse AI SQL assistant in Chartbrew" width="2400" height="1184" data-path="images/integrations/data-visualization/chartbrew_06.webp" />

    Once the data is retrieved, click **Configure dataset** to set up the visualization parameters.
  </Step>

  <Step title="Create a visualization" id="4-create-a-visualization">
    1. Define a metric (numerical value) and dimension (categorical value) for your visualization.
    2. Preview the dataset to ensure the query results are structured correctly.
    3. Choose a chart type (e.g., line chart, bar chart, pie chart) and add it to your dashboard.
    4. Click **Complete dataset** to finalize the setup.

    <Image img="https://mintcdn.com/private-7c7dfe99/PWQnWTwcu17exYX2/images/integrations/data-visualization/chartbrew_08.webp?fit=max&auto=format&n=PWQnWTwcu17exYX2&q=85&s=ea7e3735656b4138e4687a38f32b2521" size="lg" alt="Chartbrew dashboard with ClickHouse data" width="2400" height="1068" data-path="images/integrations/data-visualization/chartbrew_08.webp" />

    You can create as many datasets as you want to visualize different aspects of your data. Using these datasets, you can create multiple dashboards to keep track of different metrics.

    <Image img="https://mintcdn.com/private-7c7dfe99/PWQnWTwcu17exYX2/images/integrations/data-visualization/chartbrew_01.webp?fit=max&auto=format&n=PWQnWTwcu17exYX2&q=85&s=7976a96696512f77018ba05775788b7b" size="lg" alt="Chartbrew dashboard with ClickHouse data" width="2400" height="1289" data-path="images/integrations/data-visualization/chartbrew_01.webp" />
  </Step>

  <Step title="Automate data updates" id="5-automate-data-updates">
    To keep your dashboard up-to-date, you can schedule automatic data updates:

    1. Click the Calendar icon next to the dataset refresh button.
    2. Configure the update interval (e.g., every hour, every day).
    3. Save the settings to enable automatic refresh.

    <Image img="https://mintcdn.com/private-7c7dfe99/PWQnWTwcu17exYX2/images/integrations/data-visualization/chartbrew_09.webp?fit=max&auto=format&n=PWQnWTwcu17exYX2&q=85&s=ffe9e46d7d16433d8e2f1c7f71266c62" size="lg" alt="Chartbrew dataset refresh settings" width="1600" height="899" data-path="images/integrations/data-visualization/chartbrew_09.webp" />
  </Step>
</Steps>

<h2 id="learn-more">
  Learn more
</h2>

For more details, check out the blog post about [Chartbrew and ClickHouse](https://chartbrew.com/blog/visualizing-clickhouse-data-with-chartbrew-a-step-by-step-guide/).