We’d like to welcome Sayed Alesawy, Backend Lead at Instabug as a guest to our blog.
What is Instabug?
Instabug is an SDK that empowers users to monitor, prioritize, and debug performance and stability issues throughout the entire mobile app development lifecycle. The Instabug SDK provides a suite of products, mainly, crash reporting and application performance monitoring (APM) which allows you to monitor every aspect of your application’s performance like crashes, handled exceptions, network failures, UI hangs, launch and screen loading latency and of course the ability to setup your own custom traces to monitor critical code sections. Instabug also allows you to automate your workflows via a rules and alerting engine which ships with many useful integrations with other project and incident management tools like Jira, Opsgenie, Zendesk, Slack, Trello and many more.
Performance monitoring challenges
The challenge when working with performance metrics mainly lies into two points:
1. Performance metrics rely heavily on events that are by nature very frequent and vast, which poses a challenge in being able to receive and efficiently store those events.
2. Performance events are not really useful in their raw format, users don’t want to go through millions of events to extract an insight. They need visuals and aggregates to help them make sense of this data which almost always requires some very heavy business logic that has to be performed which involves a lot of querying and data visualization.
All things considered, Instabug’s backend is very large scale. To give you a quick glimpse, at Instabug we run multiple kubernetes clusters in a microservice oriented architecture consisting of dozens of microservices and datastores. Our APIs average approximately 2 million requests per minute and terabytes of data going in and out of our services daily.
Where did we use ClickHouse?
In most of our products we follow a pattern where MySQL is the primary datastore which serves as the single source of truth that serves all writes and some light reads (mainly point queries) and we index data into Elasticsearch clusters which we use to serve more complex reads, such as filtering, sorting and aggregating data.
When building APM, we realized that this would be our largest scale product in terms of the amount of data it would have. To give you a quick overview of the data scale of APM, we store approximately 3 billion events (rows) per day at a rate of approximately 2 million events per minute. We also have to serve some pretty complex data visualizations that depend heavily on filtering very large amounts of data and calculating complex aggregations in a reasonably fast time frame for the sake of the user experience.
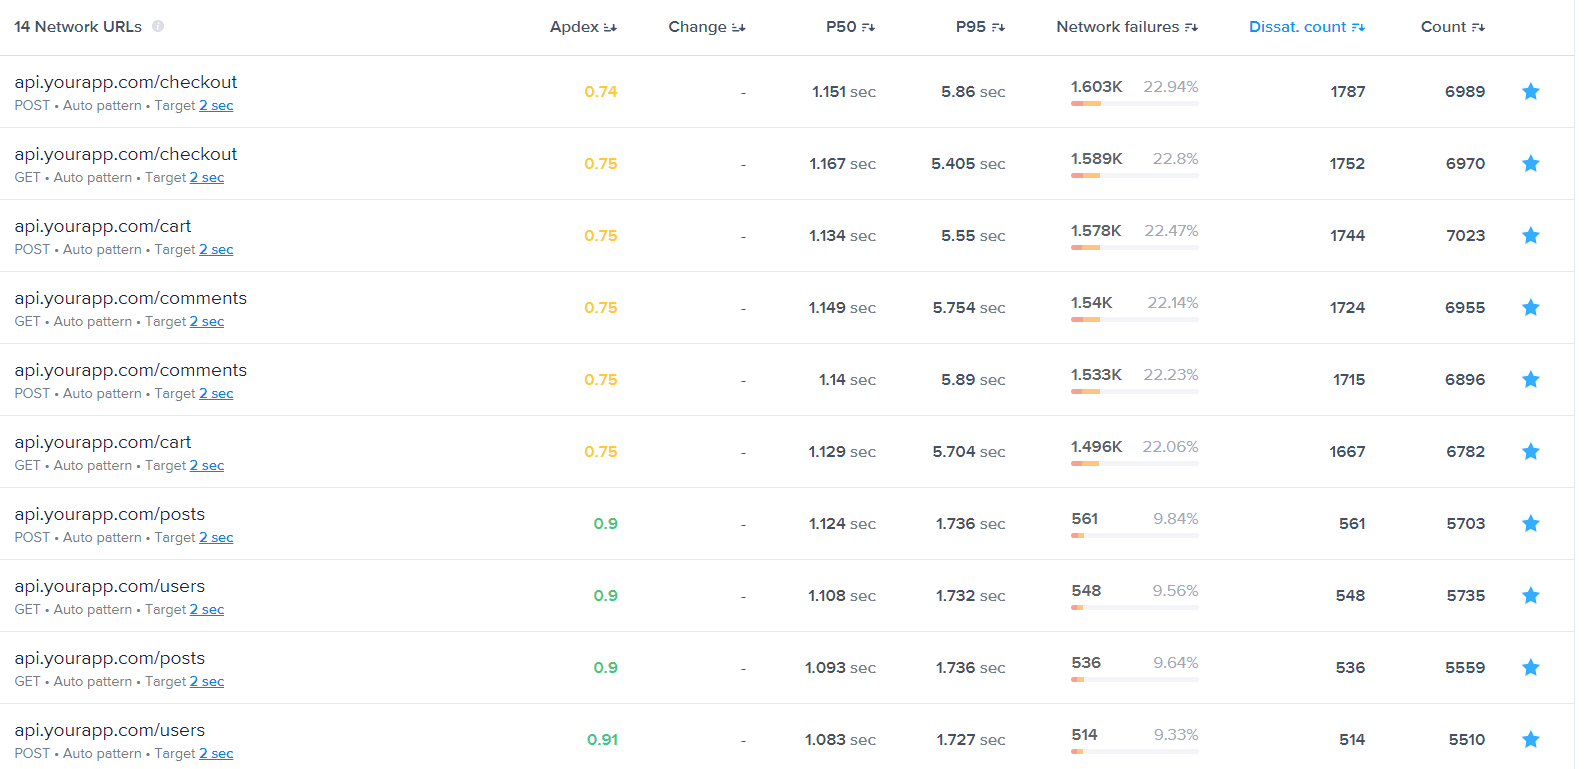
The following are some examples of the data visualizations we provide in our APM dashboard for our users:
- In this data visualization, users are able to get a holistic view of all their network groups to detect problematic groups for further inspection. In such a visualization, we have to calculate aggregate data from the occurrences of each group, such as count, failure rates, response time percentiles, apdex scores, etc. This data visualization can be filtered and sorted in both directions by any column.
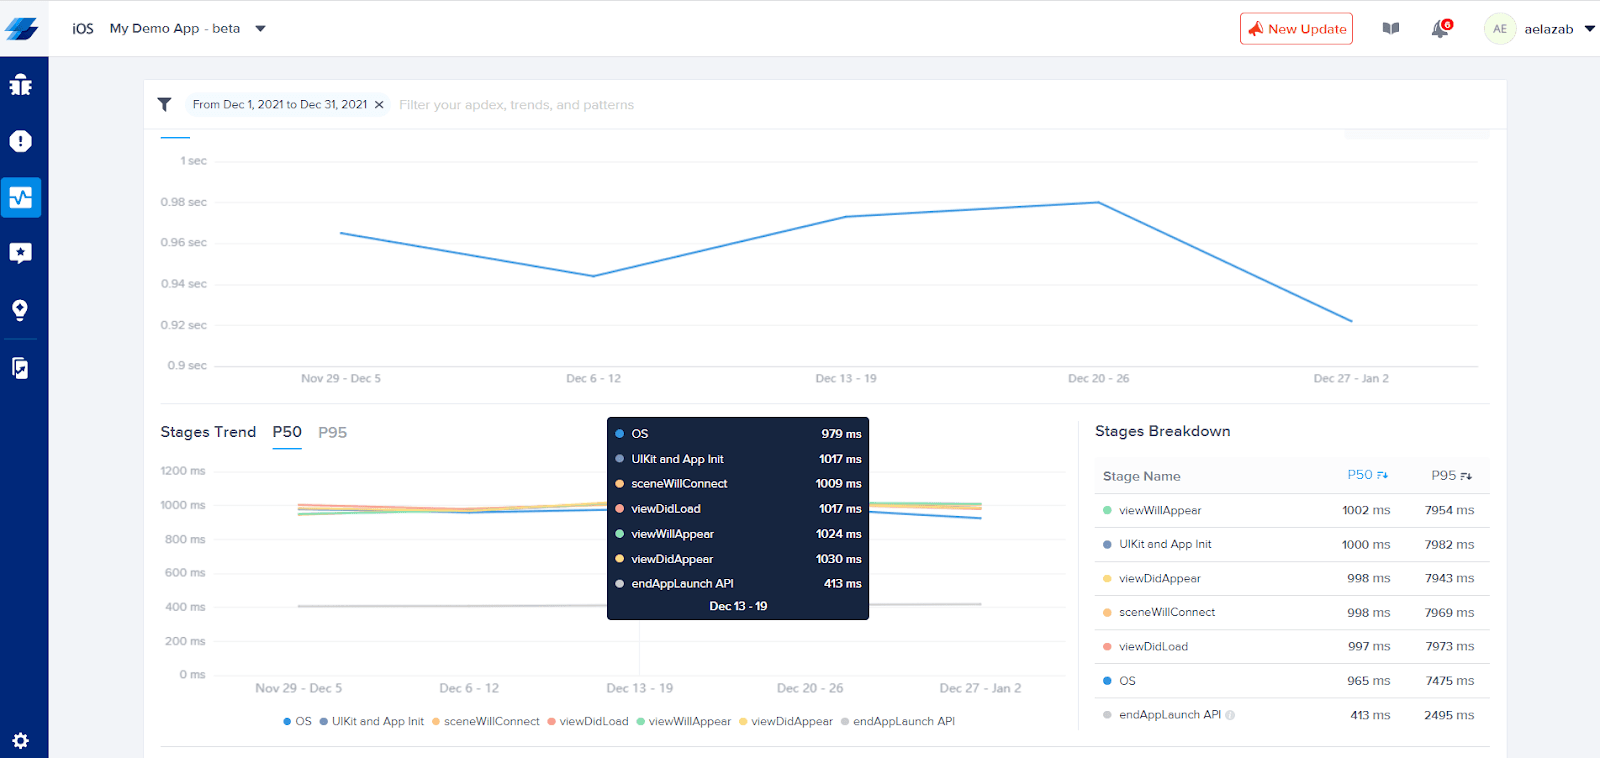
- When a user wishes to dig deeper into a specific group to debug an issue, let’s say a latent app launch for example, the following data visualization shows the details of a cold app launch. In such a visualization, we need to calculate histograms in which every datapoint has a breakdown of the latency of each stage in the app launch and at the same time generate a table with the totals of those breakdowns.
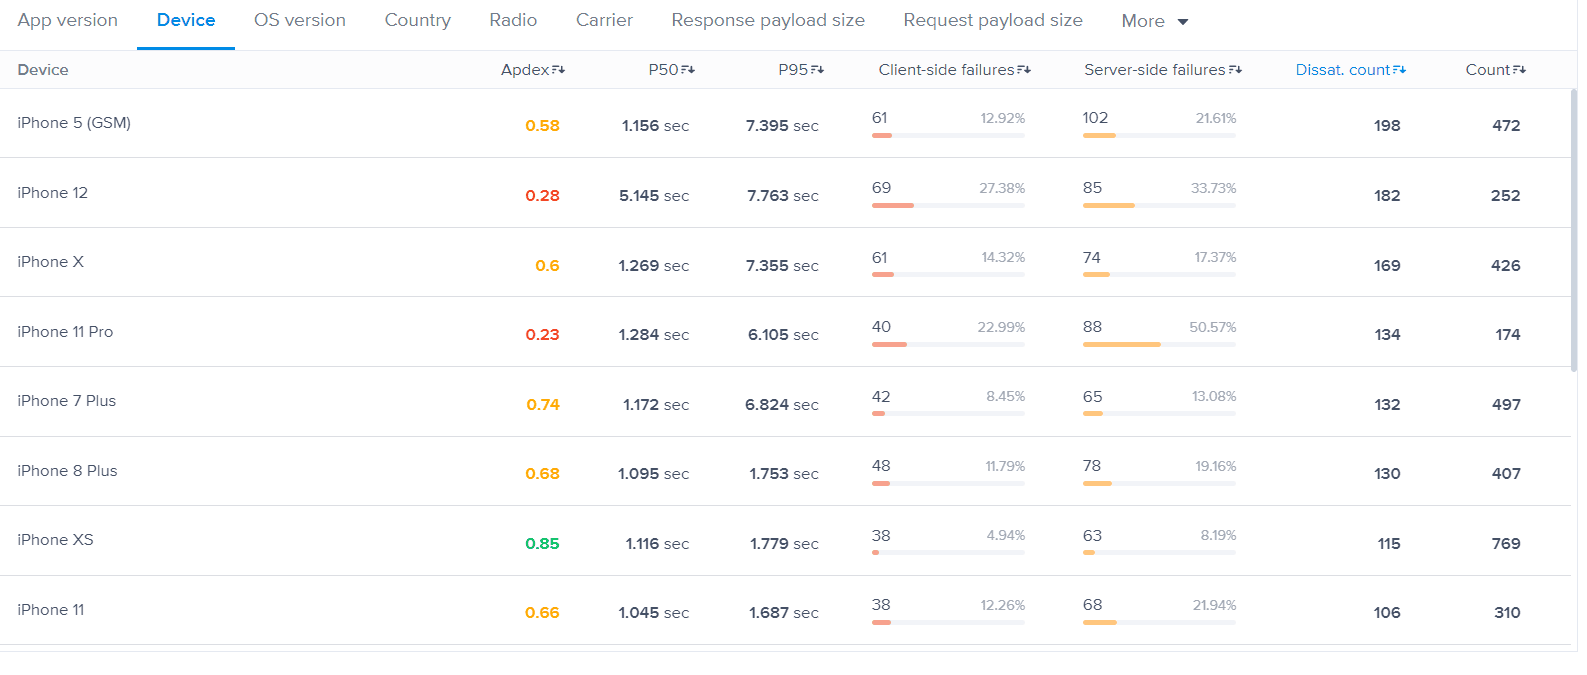
- Unlike the first data visualization, sometimes users would like to get a breakdown of their scores by specific attributes, like for example, the failure rate measured per device type so we group by different values of some field within a data entity and perform similar aggregations to the first visualization.
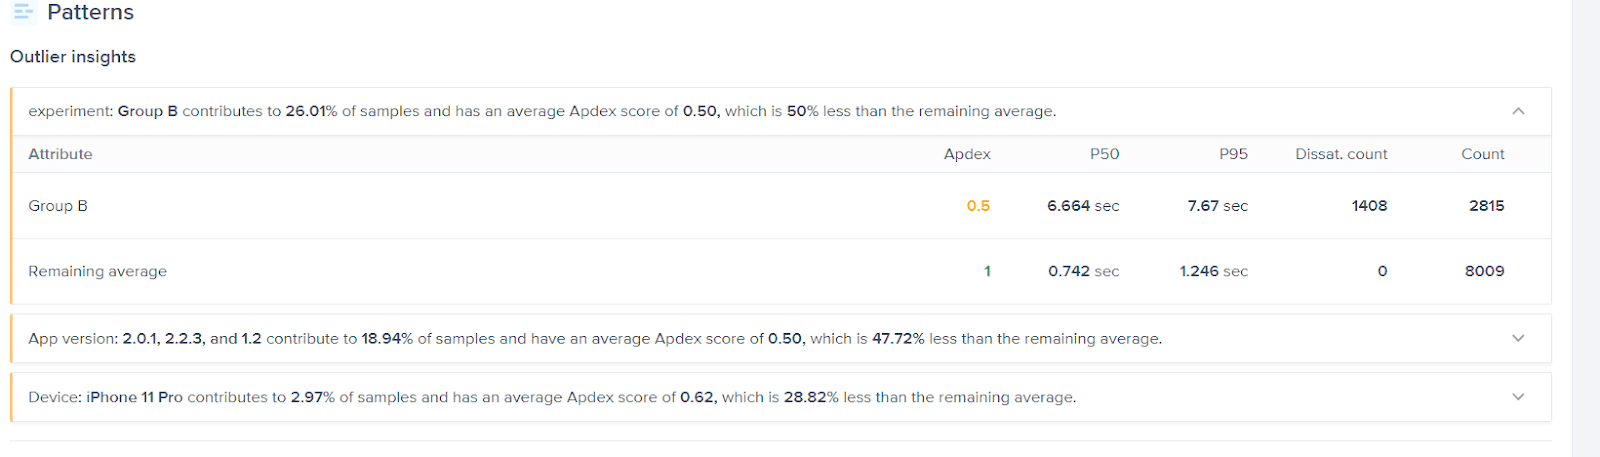
- While all previous views can be generated for the entire data set, sometimes our users would like to know if there are any outliers to the data set without having to go through all data manually. In the following data visualization we run, probably our most complex and expensive query ever, which detects if there are any outliers within the data set.
Why didn’t Elasticsearch work for us?
At the very beginning, we designed APM the same way we do with all our other products. Yet we faced performance issues with Elasticsearch, mainly for reads, but writes were also not as fast to consume our load. We tried a lot of solutions like trying different node/shards configurations, running multiple Elasticsearch clusters, creating daily indexes to minimize the amount of data we have to go through for recent date filters ranges, etc. which made Elasticsearch continue for a little longer… but we realized that it would not scale and we needed to find another solution.
Enter ClickHouse
We experimented with a few datastores to find an Elasticsearch alternative for APM and we found out about ClickHouse. We started experimenting with ClickHouse, getting to know its features, we wrote our Elasticsearch queries in ClickHouse and started performance testing activities and we realized that ClickHouse is actually performing way better for both reads and writes and a decision was made to start migrating to ClickHouse.
At the beginning, we couldn’t just freeze work on the product itself to migrate to a new datastore.We also didn’t have experience with operating ClickHouse, so we didn’t want to roll it out to production in one go. Therefore, we had to come up with ways to make our code and infrastructure versatile enough to allow for an incremental rollout and experimentation. We refactored the code to abstract dealing with the datastore, so the code would no longer be coupled with whatever datastore we are using, now it can read and write to different datastores based on some dynamically provided configuration which allows us to:
- Be able to write all new data to both ClickHouse and Elasticsearch to minimize migration effort.
- Be able to have specific users write/read data from ClickHouse while all other users are writing/reading data from Elasticsearch, which was crucial to gain confidence via an incremental rollout.
- Be able to still add new features for both Elasticsearch and ClickHouse and have them available for the experiment group and the main production whenever we wish.
It took us around 5 months to completely migrate to ClickHouse, so having a configurable and versatile infrastructure was crucial to help us keep improving our product while actively migrating a core part of our infrastructure such as a main datastore.
The configuration infrastructure we built during the migration is actually still in use at the moment to allow us to run multiple clusters and even host different event metric data into different databases or clusters as per our needs.
Current architecture using ClickHouse
The following diagram shows the overall architecture of APM:
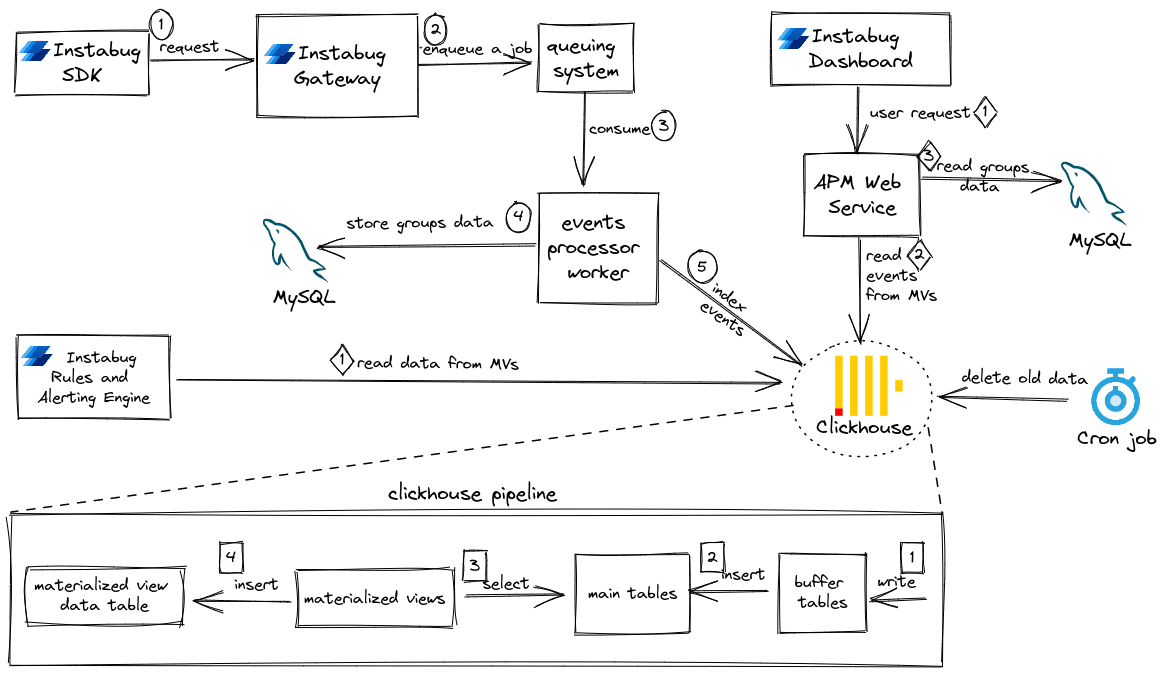
We receive events data from our SDK at a very high rate, so we created a very lightweight and fast gateway service that regulates this high rate into a constant flow of background jobs. Then, our event processor worker processes those background jobs from our queuing systems and does our business logic that validates, classifies and groups those events into parent groups which are later inserted into MySQL. Then the events data itself is indexed into our ClickHouse clusters.
Our ClickHouse data scheme is as follows:
- We have multiple tables that are partitioned and ordered by multiple columns (usually you choose columns that commonly occur in
WHEREclauses). For example, one of our partitioning keys is thedatewhich allows us to have a partition of data per any date range we wish. - We also use materialized views in the
TOform which are materialized views backed by data tables. For every one of our tables, we have multiple materialized views to serve a multitude of data visualization and filtration use cases. - We run retention cronjobs that delete old data when their retention period expires. Currently we design our retention jobs to drop partitions as opposed to using
ALTER TABLE DELETEwhich are known to be expensive in ClickHouse.
Our ClickHouse infrastructure consists of multiple clusters, each running in primary-replicas configuration and the replication is managed by ZooKeeper. Here we try to use instance types that are suitable for the task; for example, it makes sense to use instance types that are optimized for CPU, memory, storage and network for the database nodes while using instance types are suitable for an in-memory cache for the ZooKeeper nodes.
Why does ClickHouse work so well for us?
ClickHouse did so well with helping us scale APM because:
- ClickHouse is a columnar database designed for heavy analytics, which really matches our use case. We are able to achieve much better response times with ClickHouse than we did with Elasticsearch.
- ClickHouse supports Materialized Views (MVs), which are a very crucial part of our ClickHouse data pipeline. As a matter of fact, we never query the original raw tables — we just use them to serve as a single source of truth to restore data or to re-populate the MVs if needed, rather, we always read from MVs because they are much smaller in size and they have the data we are looking for already aggregated. Using MVs was the most important part of achieving good response times (it takes a great deal of care to design good MVs).
- ClickHouse supports a family of MergeTree table engines which are LSM-trees (Log Structured Merge Trees) that are known to have a very good write throughput (writes are merely appends to an internally sorted data structure like a red-black tree for example and merges are done in the background). This was also crucial for us because we have a high write throughput (~2 million events per min), so we use the ReplicatedMergeTree engine. ClickHouse writes work best when data is inserted in large batches, so we build our indexers to optimize for this as well.
- ClickHouse supports data compression as it compresses data on disk to save space. An example for this, back when we were running Elasticsearch, we had an index that had around 307 million documents which took up 50GB of disk. Now, the same index but in a ClickHouse table has around 30.5 billion rows taking up to 350GB which with simple linear interpolation would have taken Elasticsearch around 500GB to store, this is a saving of at least 30% in disk space.
- ClickHouse turned out to be much cheaper to operate, we were able to dramatically reduce the number of machines we had with Elasticsearch. It’s worth mentioning that our data scale has more than tripled since we migrated from Elasticsearch, so the cost saving now is even much greater.
- ClickHouse provides a very SQL like query interface which everyone was familiar with and it made re-writing our Elasticsearch queries into ClickHouse easier.
- ClickHouse provides a lot of aggregate functions which also helped us write new features into ClickHouse.
Lessons learned and challenges
While migrating to ClickHouse we faced some challenges that we had to work around. Some of those challenges were:
- It was the first time for us to operate a unmanaged datastore, all our datastores such as MySQL, Elasticsearch and Redis are part of AWS managed cloud services which offers so many useful operation features like scaling, replication, failover, monitoring, automated snapshots and version upgrades, etc. ClickHouse is not part of that, we had to run it on bare EC2 machines and manage it ourselves, which was challenging.
- ClickHouse doesn’t come with an ORM like ActiveRecord for example, so we had to build a query engine to abstract some of the bare ClickHouse code and most importantly, write it in a secure way so that it’s not susceptible for attacks like SQL injection for example (ORMs usually take care of that for you by default).
- Our ClickHouse schema evolves as business needs change, so it’s almost always the case that we need to add new columns or alter the definition of the MVs or even create new ones. We had to figure out ways to write those migrations efficiently, especially when it comes to repopulating the MVs. We also have to run the same migrations multiple times once for each cluster that we run, so we had to figure out ways to automate this to save time. Automating those migrations helped us have a standard of how to do things which helps avoid repeating old mistakes.
- Some of the aggregations we used to rely on while using Elasticsearch is its ability to construct histograms of data with different buckets in an out-of-box way. ClickHouse doesn’t support that so we had to build that code ourselves while migrating.
- Our codebases that access ClickHouse use Ruby on Rails and Golang as programming languages, it turned out that the adapters for Ruby and Go were different in terms of the protocol they use to communicate with ClickHouse as one uses HTTP and the other uses TCP, so we had to cater for that in a configurable way.
We have also learned some lessons, for example:
- ClickHouse offers many data types and they affect how it performs so we had to carefully choose the correct data type for every column and avoid using
NULL. - Table partitioning keys in ClickHouse are crucial for good performance and that we can’t have too many parts, so we had to choose those keys with care. We had multiple iterations with this to find what would work best for our use case.
- ClickHouse has primary keys but they are not unique and attempts to use a unique key, especially if random like a UUID, would most definitely ruin compression and will result in very large datasets. We learned this the hard way.
- ClickHouse is an analytics database, so it’s designed mostly for immutable data, it works very well for reads but performs badly for updates and deletes (as it has to reorder data parts which is expensive). So we learned to choose what to store in ClickHouse and what to store in MySQL and we also had to design data parts in a way that supports deleting data via dropping a part instead of using deletes.
- ClickHouse materialized views are very good for read performance so we had to learn how to design materialized views in a way that would result in small MVs compared to the original table size to have better query response times. This included efforts to decrease the cardinality of an MV by rounding some fields and so on.
- ClickHouse supports buffer tables for writes, which turned out to be very useful for handling our very high write throughput.
Conclusion and general advice
Migrating to a completely new datastore can be a very daunting task that’s full of challenges. The key for a successful migration for us was thorough research and versatile code and infrastructure. The thorough research helps you make informed decisions and understand the features and the limitations of the datastore you’re using and the one you’re migrating to. The versatile code and infrastructure is useful for experimenting and gradual rollout, which is important in sensitive production environments.
We started this migration with a datastore that was a bottleneck to our product development, but via careful planning we ended up with a datastore that has been serving us well for almost a year and will continue to serve us well for the years to come.